February 8, 2021, | AtoZ Markets - U.S. stocks were upper after the end last week, as gains in the Consumer Goods, Basic Materials, and Oil and Gas areas drove shares higher. At the end of the NYSE, the Dow Jones Industrial Average acquired 0.29%, while the S&P 500 index gained 0.38%, and the NASDAQ Composite index rose by 0.48%. Dow Jones is currently trading around $31,250 price area and trying to recover higher. After bouncing from $29,800 to $30,000 support level, the bulls pushed the price upward quite impulsively, but failed to break over $31,200 to $31,250 key level. As per the current price action, the price may retrace downside towards $30,850 to $30,800 price area in the coming days.
Dow Jones Industrial Average Facing Resistance as the Key Level Working Strongly
Dow Jones is currently residing near $31,250 price area and trying to recover upside. However, the price also broke over the dynamic level of 20 EMA on the intraday chart.

Image: DJI 4 Hour Chart
According to the 4-hour chart, Dow Jones Industrial Average is facing resistance and currently trading around $31,250 price area. As per the current scenario, if the price can have a bearish candle close below $31,250 to $31,200 price area, the bears may regain momentum and decline towards $30,850 to $30,800 price area in the process. So, if the price reaches $30,850 to $30,800 price area and bounced upside with an impulsive bullish candle, the bulls may sustain the bullish pressure towards $31,200 to $31,250 price area again in the coming days.
Furthermore, the dynamic level of 20 EMA is currently residing below the price. So, it may pull the price down as a mean reversion. Besides, the Stochastic Oscillator lines are currently residing above the overbought level 80 and may have a bearish crossover. It indicates that bears may regain momentum in the days ahead.
DJI May Sustain the Bullish Bias Further
According to the daily chart, Dow Jones Industrial Average is facing resistance, but the overall bias is still bullish. As per the current price action, if the price retraced towards $30,850 to $30,800 support area and bounced upward with a daily bullish candle, the bulls may sustain the bullish trend towards $31,200 to $31,250 price area as a first target. The second target will be $31,500 to $31,600 price area if the price can break over $31,200 to $31,250 price area in the coming days.
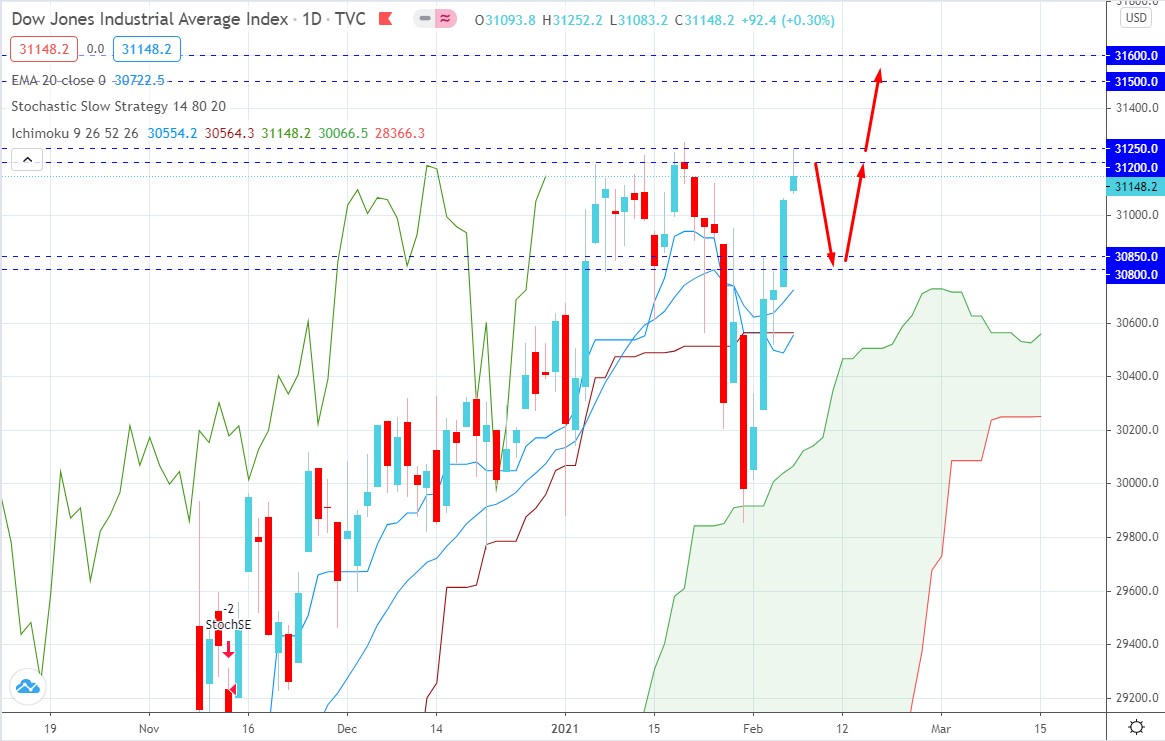
Image: DJI Daily Chart
Furthermore, the dynamic level of 20 EMA is currently residing below the price. Along with the Kijun line and the Tenkan line. So, the dynamic level may act as a strong support to push the price upward. Besides, the Kijun line and the Tenkan line may work as a confluence of the dynamic level in the process.
To conclude, the bulls are still optimistic about recovering further higher, but the price requires a downside retracement. A daily close is required to identify the definite momentum in the days ahead.

