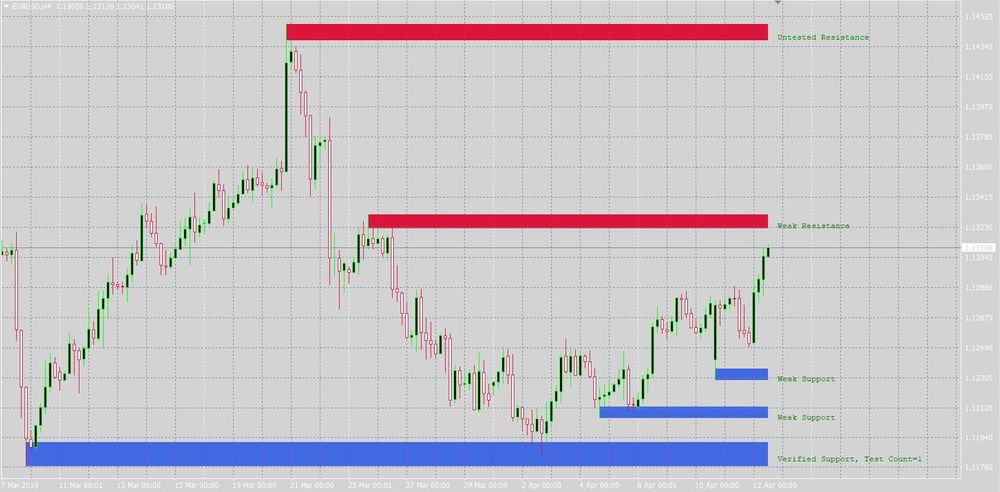
This indicator allows you to see the most important support/resistance areas that are being monitored by traders and institutions. This indicator will allow you to see a high probability market reaction to the zones.
The concepts of support and resistance are undoubtedly two of the most highly discussed attributes of technical analysis. Part of analyzing chart patterns, these terms are used by traders to refer to price levels on charts that tend to act as barriers, preventing the price of an asset from getting pushed in a certain direction.
Support is a price level where a downtrend can be expected to pause due to a concentration of demand. As the price of security drops, demand for the shares increases, thus forming the support line. Meanwhile, resistance zones arise due to a sell-off when prices increase.
Once an area or "zone" of support or resistance has been identified, it provides valuable potential trade entry or exit points. This is because, as a price reaches a point of support or resistance, it will do one of two things – bounce back away from the support or resistance level, or violate the price level and continue in its direction – until it hits the next support or resistance level.
Important Support Resistance Price Zones Indicator works well on 15M, 30M, 1H, and 4H time frames and any currency pair.
How to trade using the Important Support Resistance Price Zones Indicator
The indicator's key features are the support and resistance price areas that are being closely watched by large banks, financial institutions, and forex traders. This indicator will highlight the most profitable price zones and indicate where price movements with lucrative opportunities are likely to occur. These price zones are important to monitor for professional forex traders.
You can trade the S/R areas and the indicator in a variety of profitable ways. These are the most popular strategies:
- Trade pullbacks - Range trading
- Trade reversals occur when supports become resistances, or resistances become support.
- Profits can be taken or stop-loss set based on resistance/support zones.
Want to trade with Support Resistance Price Zone indicator? Open a free account with AtoZ Markets approved forex brokers:


How to download and install an indicator?
In order to install the indicator on your MT4 platform, you need to follow these steps:
- Click on the “Download Indicator” button located at the bottom of the screen.
- Save the file to your computer.
- Extract and move the files into MT4>Indicator folder of the MetaTrader 4 software file directory.
- Restart your MetaTrader platform.
- Navigate to “Indicators.”
- And select the “Important Support Resistance Price Zones Indicator” template to apply it on the chart.
Note: This indicator was developed by fx trading revolution. AtoZ Markets does not carry any copyrights over this trading tool.
Should you trade with Support Resistance Price Zone Indicator on your own at all?
Before you start trading with Support Resistance Price Zone Indicator, you'll want to read this.
Our in-house trading expert Dr Yury Safronau, PhD in Economic Sciences, gives you daily his best forex, metals, and cryptocurrencies to buy and sell signals right now.
His trading strategies which are based on non-linear dynamic models have achieved more than 65 000 pips of profits since 2015. And right now there are some very strong buy and sell signals across several markets you don't want to miss.
Want to see which ones?


