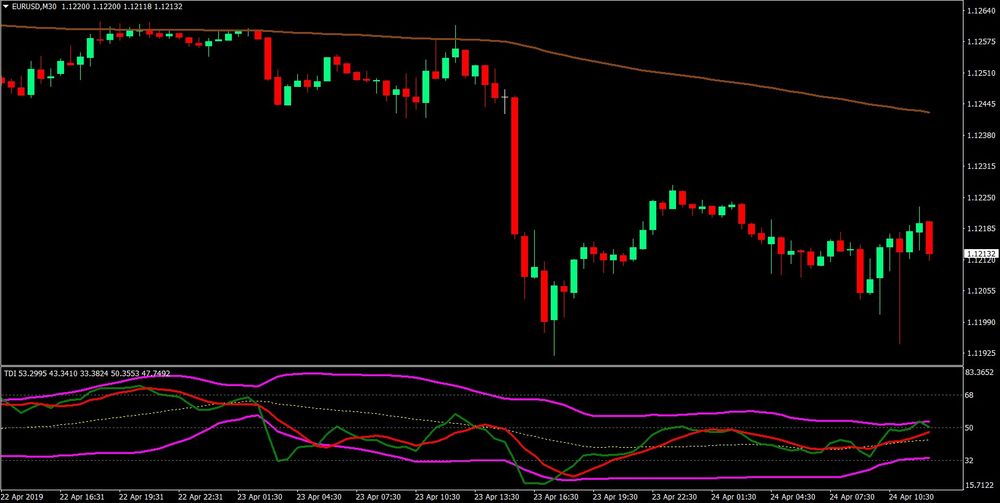
You can now download the Advanced TDI Breakout Trading Strategy for free on AtoZ Markets indicators gallery.
One of the most popular custom technical indicators used by forex traders is the Traders Dynamic Index (TDI). This indicator combines a lot of information in one indicator.
It features a Bollinger Band-like feature that allows traders to identify overbought or oversold market conditions on a dynamically moving linear line. This line also acts as support or resistance. It is plotted on fixed ranges, so it can be used to identify an overbought/oversold market condition.
It has an RSI line that mirrors price movements and a signal line derived form an MA that acts as a crossover sign. These features make the TDI a complete technical indicator for forex traders.
Advanced TDI Breakout Trading Strategy works well with all currency pairs and timeframes.
How to trade Advanced TDI Breakout Trading Strategy
This combination forex trading strategy combines a TDI indicator based signal entry signal with a breakout or breakdown of a support/resistance. This strategy has a greater chance of success as it combines a powerful indicator with a widely traded price action strategy.
The 200 Exponential Moving average (EMA) can be used to filter trades and make it easier to identify the market's direction. Only long trade setups will count if the price is higher than the 200 EMA.
Want to trade with Advanced TDI Breakout Trading Strategy? Open a free account with AtoZ Markets approved forex brokers:


Buy (Long) Trade Setup
Entry
Entry
- The price should not be lower than the 200 EMA (brown).
- As the price drops (green), a resistance line should be identified.
- The resistance line should be broken and the price should rise above it
- TDI: The RSI (green) line should be crossed above the Signal (red).
- Place a buy order at the end of the candle, following the confluence rules.
Stop Loss
Place the stop loss at the entry candle's swing low.
Take Profit
Place the take profit at 1.5 times the risk of the stop loss
Short Sale (Short) Trade Setup
Entry
- Price should not exceed the 200 EMA (brown).
- As price retraces upward (green), a support line should be identified.
- The resistance line should be broken and the price should fall below it
- TDI: The RSI (green) line should cross below that of the Signal (red).
- Place a sell order at the end of the candle if you are able to confluence the above rules
Stop Loss
Place the stop loss at the swing, higher than the entry candle.
Take Profit
Place the take profit at 1.5x risk of the stop loss.
How to download and install an indicator?
In order to install the indicator on your MT4 platform, you need to follow these steps:
- Click on “Download Indicator” button located at the bottom of the screen.
- Save the file to your computer.
- Extract and move the files into MT4>Indicator folder of the MetaTrader4 software file directory.
- Restart your Metatrader platform.
- Navigate to “Indicators.”
- And select “Advanced TDI Breakout Trading Strategy” template to apply it on the chart.
Note: This indicator was developed by Tim Morris. AtoZ Markets does not carry any copyrights over this trading tool.
Should you trade with Advanced TDI Breakout Trading Strategy on your own at all?
Before you start trading this strategy, you'll want to read this.
Our in-house trading expert Dr Yury Safronau, PhD in Economic Sciences, gives you daily his best forex, metals, and cryptocurrencies to buy and sell signals right now.
His trading strategies which are based on non-linear dynamic models have achieved more than 65 000 pips of profits since 2015. And right now there are some very strong buy and sell signals across several markets you don't want to miss.
Want to see which ones?


