Ethereum is changing hands near $2,100 in May 2026. That’s a long way from its all-time high of nearly $4,950 which it hit in August 2025. But analysts and forecast models are suggesting a recovery may be underway. The question is how fast can it go? Can ETH close the gap to $3,000 before the end of July? This article sets up the technical picture, catalysts, analyst targets, and risks.
Ethereum’s Price Performance in 2026 So Far
ETH started 2026 on a great note. It was $3,100 in the early January, riding the wave of a strong 2025 close. But it dipped quickly.
By early February, ETH was back down to about $2,900. Then the pain came. ETH fell to near painful low of $1,755 in the first week of February, the steepest drop of the year. It bounced from there to nearly $2,000 by the end of the month.
From March, ETH has bounced between $2,000 and $2,450. It got a boost in mid-April when the price emerged higher towards a monthly high of about $2450 after positive macro news and growing interest from the likes of mutual funds. Since that time ETH has dipped again, now consolidating from $2100 to $2200.
The ETH/BTC ratio has been under pressure for most of 2026, Bitcoin doing better than Ethereum at large stretches. This has kept sentiment cautious towards the asset.
Current Technical Analysis
As seen at the end of May 2026, Ethereum is trading in about the $2,100-$2,130 range. The technical configuration of Ethereum is somewhat mixed, but not largely bearish.
Support: The main support areas are from $2,075-$2,085. If these are broken, the next significant support level would be from $2,000 down to $1,800.
Bullish breakouts will only occur if Ethereum breaks above $2,150-$2,170. The next big resistance level is $2,300. A bullish breakout to $3,000 will not occur until Ethereum has cleared both of the previous resistance levels.
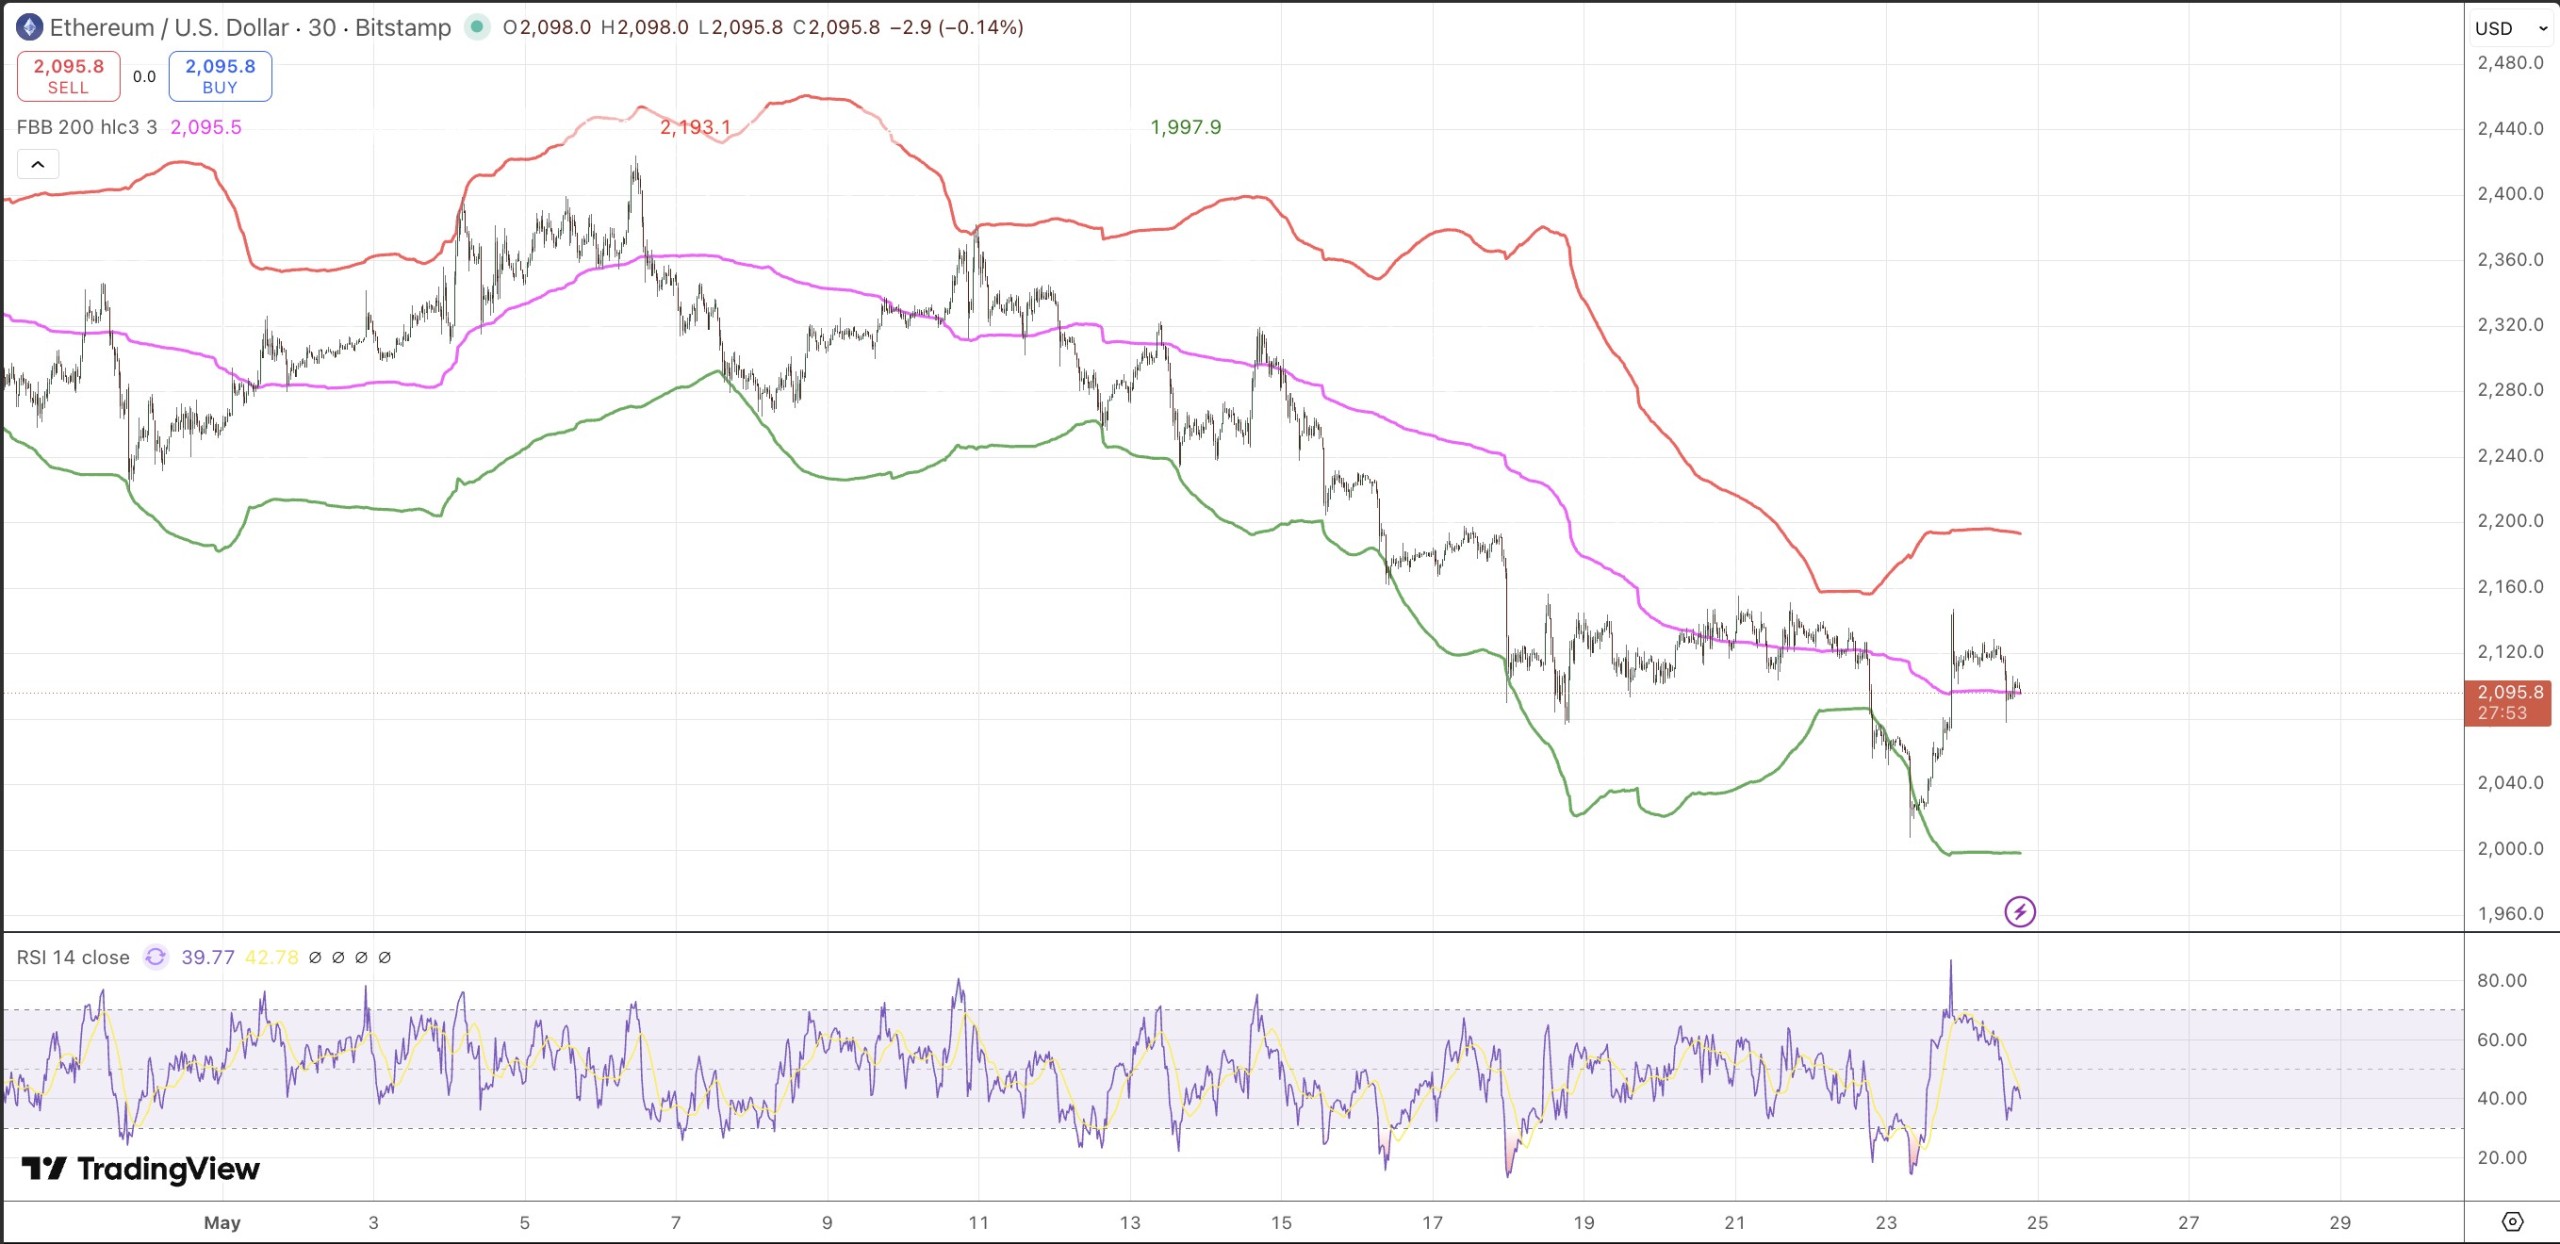
The current 14-day RSI is hovering between 31-36, close to being oversold. RSI can indicate that a bounce may occur, but they also reflect a lack of momentum.
Currently, the average price of Ethereum is approximately $2,116 (200 Day MA). This would be considered bearish at this time. It has historically been considered one of the better signs of a sustained uptrend when Ethereum closes above the 200 Day MA. Reclaiming this level will be an important step for Ethereum.
The overall trend in Ethereum is currently bearish to neutral. Ethereum has had lower highs in the past month. To change this trend, there will need to be significant volume above $2,300.
Key Catalysts That Could Push ETH to $3,000
Though there has been some short-term weakness in technical indicators, it’s more likely that we will see some notable catalysts that will have an significant impact until the end of July.
1. Glamsterdam Upgrade
This is by far the most important reason for the rise of ETH thus far into 2026; The Ethereum Foundation has just announced in May 2026 that the Glamsterdam upgrade is anticipated to take place in Q3 2026, which falls right about the time frame as the end of July.
Out of all of the hard forks that Ether has undergone since The Merge, Glamsterdam is probably the most influential. Glamsterdam introduces Enshrined Proposer/Builder Separation (ePBS) as well as Block Level Access Lists, which will allow for the ability to execute parallel transactions together. In addition to this feature, it also creates an increase in the block gas limit to a range of 200 million (from 60 million) after the upgrade; This is a 3x increase in the capacity of ETH’s network and because of that, Rollup fees could potentially decrease by as much as 70%.
Historically, large Ethereum upgrades also received price increases prior to the actual upgrade itself; if Glamsterdam releases a mainnet launch date in advance of the end of July, then anticipate this to act as a price catalyst.
2. ETFs Inflows and Institutional Purchases
In the first three trading days of May 2026, ETH ETFs on the spot market saw a total of over $250 million in cumulative flow. BlackRock was the major player with its ETHA and ETHB products leading the charge; Fidelity’s FETH fund was also heavily invested. Combined these two products accounted for most of the inflow.
After seeing a tremendous outflow of capital in 2025, April 2026 saw a large reversal for the spot market in terms of ETF flow, with $356 million in net inflow. This indicates that there is renewed institutional interest in ETH. Additionally, throughout 2026 large corporate treasury firms (such as BitMine) have been accumulating ETH causing liquid supply to be further constrained.
3. Bitcoin Correlation and Market Psychology
While BTC remains stable or rises, generally speaking, ETH tends to mirror or trade in correlation with movement in BTC. If BTC can continue to demonstrate strength after the end of Q2 and into Q3 (as of this writing) then ETH will have an advantageous macroeconomic environment due to positive shifts in overall crypto market psychology from “fear” to “greed”.
4. Macro Economic Environment
The Federal Reserve’s interest rate policy represents a wild card for all financial markets but particularly for crypto and high beta assets like ETH. If the Federal Reserve were to send a dovish signal (or cut interest rates) prior to July this would create the potential for a significant risk on move for both equities and fixed income. In those situations we can see an outsized benefit to high beta assets like ETH.
What Analysts and Forecast Models Are Saying
There are many analyst predictions for what Ethereum’s price will be at the end of July. However, a lot of them are coming in around that USD $3,000 benchmark.
One aggregated forecast model puts ETH’s July 2026 trading range between $2,138 and $2,608, with an average around $2,373. A more bullish model projects the July average closer to $3,089. LiteFinance states that most analysts expect that at some point in 2026 ETH will be able to consolidate above the USD $3,000 psychological level and test a high value of approximately USD $3,210. CoinDCX’s forecast model places values between USD $2,080 and USD $3,260.
The bullish case for achieving a value of USD $3,000 by the end of July would require Ethereum to break above value levels of USD $2,300 and USD $2,600 successively; about a 40% increase over current values in less than 60 days. It is possible, since ETH has achieved similar increases in shorter timeframes, but there needs to be a reason for the price point increase to occur.
The bearish case sees Ethereum remaining below value levels of USD $2,300; the launch of Glamsterdam experiences further delays; the continued failure of ETFs to receive capital inflows; and macroeconomic headwinds continue putting pressuring on risk assets which would leave ETH price values between USD $1,900 and USD $2,200 in late July.
Various on-chain metrics provide some moderate bullish signals for ETH. Total DeFi TVL rebounded back to USD $45.74 billion as of early May, with approximately 68% of all global DeFi TVL represented by ETH. Additionally, netflow data for exchanges has started to exhibit some mild accumulation at lower value levels.
Risks to Watch Before July Ends
While the circumstances surrounding a potential increase to $3,000 appear to be favorable, there are many different factors that may prevent this from happening:
- Macro Scope: Rising Treasury yields and a hawkish Fed viewpoint have already created downward pressure for ETH this month and may continue if the trend remains the same. If this is the case then all risk assets (including cryptocurrencies) will have difficulty rallying.
- Glamsterdam Postponement: The planned Glamsterdam system upgrade was originally intended for June and has now already moved into Q3. If further postponed, this may disappoint the market and limit the overall potential increase of ETH.
- Regulation: Any updates of negative regulation relating to the US or EU in the next 60 days will affect market sentiment rapidly.
- Game Over Whale Selling: Large investors who bought ETH long ago and have since seen their profits may use a rise towards $2,400-$2,500 to cash out and therefore, limit potential growth of ETH until after ETH has increased to $3k.
- When BTC Outperforms ETH: If Bitcoin continues to experience more absolute increase versus Ethereum, investment capital may flow into Bitcoin and will not support Ethereum’s growth.
ETH Price Prediction: July 2026 Outlook
As of July 31, 2026, these three scenarios are projected for ETH:
Bearish scenario ($1,900 – 2,100): The ETH price remains below 200 moving average for an extended period, delays to Glamsterdam is another macro headwind, resulting in ETH trading in a range or drifting lower.
Base case scenario ($2,400 – $2,700): ETH recovers above $2,300 / receives steady ETF inflows with a confirmed launch date for Glamsterdam; based on data available at this time, looks like there is a 60-70% chance that this scenario will play out.
Bullish (strong) scenario ($2,900 – $3,100): Confirmed Glamsterdam main-net date and Fed rate cut (or like) creates macro catalyst to accelerate ETF inflows to ETH, leading to a strong rally in price towards or above $3,000.
A target of $3,000 is currently seen as attainable by the end of July 2026 although this is still on the optimistic side of what can be viewed as a realistic target for ETH price.
Conclusion
Today, ETH is worth $2100 and has a lot of technical indicators for the short-term that are showing that it is in an oversold condition. But there’s a good fundamental thesis for the last half of 2026 building behind it. The Glamsterdam upgrade has a good chance of launching this year. There will also be a lot of institutional money getting back into ETH through ETF vehicles. $3,000 is still in range if the right catalysts line up before the end of July.
The important level to keep an eye on right now is $2300. If ETH can break and hold that level with conviction, then the path to $3000 will be relatively open to it. If ETH can’t hold that level, then the likely situation will see ETH retest $2000 or lower. Keep an eye on the Glamsterdam launch timeline, ETF flow data, and where Bitcoin is moving. These three things will tell you much more about the direction ETH will head than any single price model.