
08 July, 2020 | AtoZ Markets – Harmonic pattern trading is an essential element of technical analysis. When the market moves within a trend continuation or reversal, it shows some signs through the price pattern. H.M. Gartley is the creator of price patterns in the stock market who considers the price pattern a reliable trading tool.
From 1932 to 2020, Gartley pattern is profitable market reversal signals in both bullish and bearish market conditions. Before moving to a more in-depth insight into this pattern, we will see the basic concept of a harmonic pattern.
What is the Harmonic Pattern?
A harmonic pattern is a trading tool that is created from the geometric calculation and Fibonacci ratios. Traders use these rules as both market continuation and reversal indicators. There are two types of harmonic patterns in the financial market. The first one is an internal pattern, and the second one is the external pattern.
The internal pattern is a geometric shape where the price moves within the form. The example of external patterns is Gartley patterns and Butterfly patterns.
Like other external patterns, a Gartley is profitable, and it has years of history to provide a decent trading result.
What Does the Gartley pattern look like?
Let’s look at what the Gartley pattern looks like including a profitable Gartley trading strategy.
Gartley Harmonic Pattern
The Gartley pattern is similar to the other harmonic pattern forming with the combination of the trendline and Fibonacci ratios. It is easy to plot in the chart As it requires only to draw a trend line and Fibonacci levels. These trading tools are free and available in most of the trading platforms.
Furthermore, G.M, Gartley, referred to this trading tool as the best trading opportunity for the financial market. Some traders name this pattern as 222 or the 222 patterns.
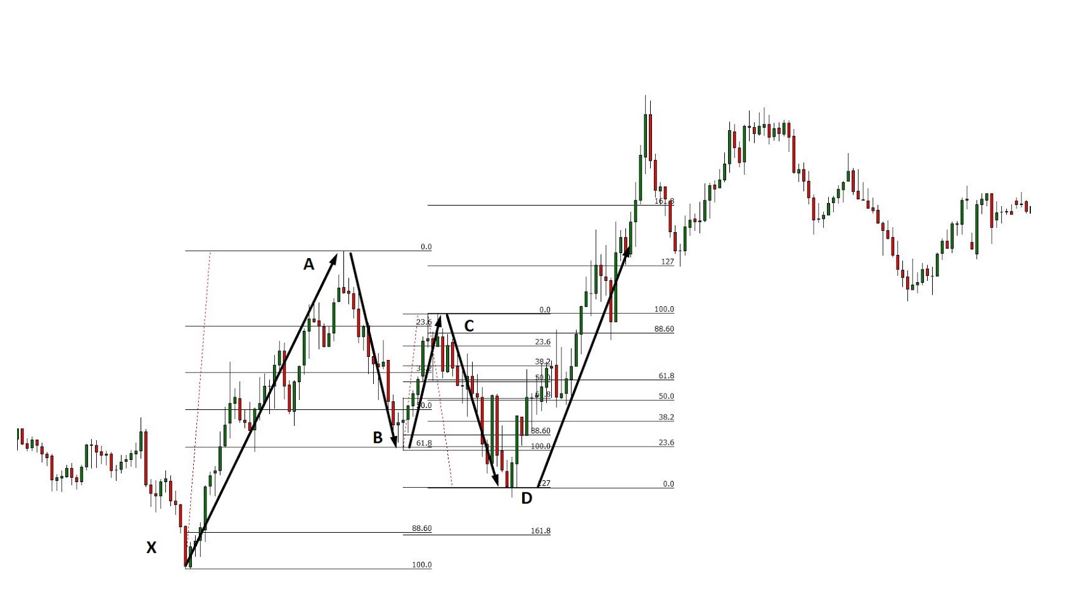
The Gartley trading pattern looks like the W/M shape in the chart. Like the butterfly pattern, it has 5 points- X, A, B, C, and D.
Let’s have a look at the components of the Gartley harmonic pattern:

- XA: In a Gartley pattern, XA is the first leg. Therefore, there is no Fibonacci calculation for the XA leg in the Gartley pattern. But the next legs are dependent on this. The XA leg is the counter-trend movement. Therefore, it becomes bullish after a bearish trend and bearish after a bullish trend.
- AB: AB is the correction of the XA leg. It can retrace up to 61.8% level of XA. It moves to the opposite direction of the XA leg. Therefore, if the XA leg is bullish, AB will be bearish.
- BC: BC is the third leg that moves to the direction of XA, but it does not create a new high or low level. BC can retrace from 38.2% to 88.6% of XA leg.
- CD: CD is the final leg where point D is the entry point. If C= 38.2% of AB, then point D would be 127.2% of BC. However, if point C = 88.6% of AC, point D would be 161.8% of BC.
Bullish Gartley Trading Strategy
As a reversal pattern, a bullish Gartley pattern will appear after a bearish trend. It will indicate the consolidation phase where market makers usually build orders.
You have to read the market carefully and match Fibonacci levels from XA leg to CD leg. While calculating the Fibonacci level, make sure to use an approximate value as the price may differ from one platform to another.
Identify the point D carefully as it is the final point of the Gartley harmonic pattern. The point D will be at 78.6% of XA and will indicate the buying point.
Look at the image below to see how a bullish Gartley pattern forms after a bearish trend.
Entry: Identify the point D and allow the price to come at point D. Wait for an appropriate reversal candlestick at point D and enter the trade after the candle closes.
Exit: X is the lowest point in a Bullish Gartley harmonic pattern. Therefore, the entry will be valid until the price remains above point X. Put your stop loss below the point X with a 10-15 pips buffer.
Take Profit: the standard take profit target for the Gartley pattern is point A. However, you can book some profit and move your stop-loss at breakeven as soon as the market reaches point C.

The image above represents the take profit techniques of the Bullish Gartley pattern.
Bearish Gartley Trading Strategy
Like the opposite of the bullish Gartley, it will appear after a bullish trend. It will indicate the consolidation phase where market makers usually build orders.
You have to read the market from XA leg to CD leg. Make sure to use an approximate value in Fibonacci levels considering the difference in prices.
Identify the point D carefully as it is the final point of the Gartley pattern. The point D will be at 78.6% of XA and will indicate the selling point.
Look at the image below to see how a bearish Gartley pattern forms after a bullish trend.

Entry: Identify the point D and allow the price to come at point D. Wait for an appropriate reversal candlestick at point D and enter the trade after the candle closes.
Exit: X is the highest point in a Bearish Gartley harmonic pattern. Therefore, the entry will be valid until the price remains below point X. Put your stop loss above the point X with a 10-15 pips buffer.
Take Profit: the standard take profit target for the Gartley pattern is point A. However, like the Bullish Gartley pattern, you can book some profit and move your stop-loss at breakeven as soon as it reaches point C.

The image above represents the take profit techniques of the Bearish Gartley.
Summary
Like other harmonic trading patterns, the Gartley harmonic pattern is very profitable. It can provide a good profit for all timeframes from 1 minute to 1 week. Furthermore, this pattern can explain the order building techniques of the market maker and how the counter movement happens. Overall, based on market sentiment and technical analysis, the Gartley pattern is an excellent trading opportunity.
Let’s summarise what we have seen reading how to trade using the Gartley pattern:
- The Gartley pattern is a harmonic pattern.
- This pattern works as a market reversal indicator. Therefore, we can find the bullish Gartley pattern in a bearish market and the bearish pattern on the bullish market.
- XA is the first leg, and CD is the final leg.
- After taking a trade, it is essential to manage the trade with a money management technique.
Think we have missed something? Let us know in the comment section below!