
The butterfly pattern is a harmonic pattern that can provide a good profit in forex, stock, and cryptocurrency markets. Butterfly trading has a strong backtesting record for many years. Therefore, if you want to trade forex using the butterfly pattern, you can make a decent profit. In today’s article, we will see how the butterfly pattern forms and how you can make a trading strategy using this tool.
AtoZ Markets – Pattern trading is very common in the forex market. Many professional and institutional traders identify the potential market reversal and continuation using the price pattern. There are many patterns in the financial market, and the butterfly pattern is one of them.
What is the Harmonic Pattern?
A harmonic pattern is a trading tool that is created from the geometric calculation and Fibonacci ratios. Traders use these rules as both market continuation and reversal indicators. There are two types of harmonic patterns in the financial market. The first one is an internal pattern, and the second one is the external pattern.
The internal pattern is a geometric shape where the price moves within the form. The example of external patterns is Gartley patterns and butterfly patterns.
Like other external patterns, a butterfly is profitable, and it has years of history to provide a decent trading result.
What Does the butterfly pattern look like?
Let’s look at what the butterfly pattern looks like including an exclusive butterfly pattern trading strategy.
Want to trade Forex using Butterfly pattern with a reliable broker? Open an account with any of the below AtoZ Markets approved forex brokers:
Butterfly Harmonic Pattern
The butterfly pattern is similar to the traditional ABCD pattern, but it works as a market reversal indicator.
As it indicates a counter trend momentum, it is usually seen at the top and bottom of the price. For example, the bearish butterfly pattern forms at the key resistance area and bullish butterfly forms in the key support area.
Within this area, the market creates a lower low and lower high and from the butterfly pattern. This pattern has four legs- XA, AB, BC, and CD. The point at X is the starting point of the pattern, and point D is the trading entry point.
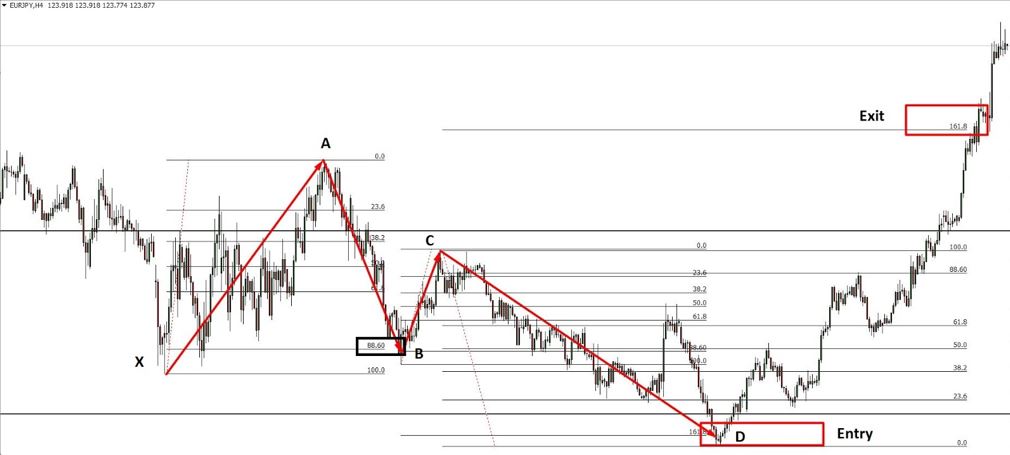
Let’s have a look at how the Butterfly pattern looks like-
- XA= XA is bullish for the bearish butterfly and bearish for the bullish butterfly.
- AB= AB retraces 78.6% of XA leg.
- BC= BC should retrace from 38.2% to 88.6% of AB.
- CD= extends up to 161.8% and even 261.8% of BC.
Look at the image below to see how a butterfly pattern looks like:

You can use the butterfly pattern as a secondary trading indicator to understand the market context. However, you can use this pattern as a separate trading strategy.
Now, we will see a butterfly trading strategy for both bullish and bearish market conditions.
Bullish Butterfly Trading Strategy
The bullish butterfly forms at the bottom of a trend and indicates a buy signal. Therefore, to trade with the bullish butterfly, you have to find a bearish trend that has moved to the potential market reversal zone.
After identifying the bearish trend, read the market from left to right, and match the Fibonacci levels, as seen in the above section.
Entry
In the butterfly trading strategy, D is the last point. Therefore, you should use the point D as an entry point. If the XA leg to CD leg forms according to the Fibonacci structure, only then point D will be valid.
To increase the probability of market reversal, wait for a reversal candlestick. In that case, the reversal candlestick might be a pinbar, two bar, engulfing bar, etc. Enter the trade after closing the candle only.
Stop-Loss
In a bullish butterfly pattern, point D is the lowest point. Furthermore, market reversal candlestick is formed at point D.
Therefore, put your stop loss below the reversal candlestick with at least 10 to 15 pips buffer. If the market becomes volatile, you can extend the buffer to 20 to 25 pips to avoid unexpected market behavior.
Want to trade Forex using Butterfly pattern with a reliable broker? Open an account with any of the below AtoZ Markets approved forex brokers:
Take Profit
Setting a take profit is tricky for the butterfly pattern. The ideal take profit level is point A. However, you can close the trade early or extend the take profit considering the market condition.
If the market shows an impulsive bullish momentum from the entry point, the price will likely reach the point A. However, if the market becomes corrective at point C, you can book some profit and move your stop loss at break even.
In the above image, we can see the visual representation of a bullish butterfly trading strategy.
Bearish Butterfly Trading Strategy
The bearish butterfly forms at the top of a trend and indicates a sell signal. Therefore, to trade with the bearish butterfly, you have to find a bullish trend that has moved to the potential market reversal zone.
After identifying the bullish trend, read the market from left to right, and match the Fibonacci levels as we have seen in the above section.
Entry
In the bearish butterfly trading strategy, D is the last point. Therefore, you should use the point D as an entry point. If the XA leg to CD leg forms according to the Fibonacci structure, only then point D will be valid.
To increase the probability of market reversal, wait for a reversal candlestick. In that case, the reversal candlestick might be a pinbar, two bar, engulfing bar, etc. Enter the trade after closing the candle only.
Stop-Loss
In a bearish butterfly pattern, point D is the lowest point. Furthermore, market reversal candlestick is formed at point D.
Therefore, put your stop loss above the reversal candlestick with at least 10 to 15 pips buffer. If the market becomes volatile, you can extend the buffer to 20 to 25 pips to avoid unexpected market behavior.
Want to trade Forex using Butterfly pattern with a reliable broker? Open an account with any of the below AtoZ Markets approved forex brokers:
Take Profit
The ideal take profit level is point A. However, you can close the trade early, or you can extend the take profit considering the market condition.
If the market shows an impulsive bearish momentum from the entry point, the price will likely reach point A. However, if the market becomes corrective at point C, you can book some profit and move your stop loss at break even.

In the above image, we can see the visual representation of a bullish butterfly trading strategy.
Summary
Butterfly trading strategy is very profitable in all market conditions. Therefore, this trading strategy works well from 5 minutes chart to the daily chart. The price formation within the butterfly pattern indicates market makers’ order building. Overall, based on the technical and sentimental analysis, the butterfly pattern provides a good trading opportunity.
Let’s summarise what we have seen reading how to trade using the butterfly pattern:
- The butterfly pattern is a harmonic pattern.
- The butterfly pattern works as a market reversal indicator. Therefore, we can find the bullish butterfly pattern in a bearish market and bearish butterfly pattern on the bullish market.
- XA is the first leg, and CD is the final leg.
- After taking a trade, it is important to manage trade with a money management technique.
Should you trade using Butterfly pattern on your own at all?
Before you start trading with butterfly pattern, you’ll want to read this.
Our in-house trading expert Dr Yury Safronau, PhD in Economic Sciences, gives you daily his best forex, metals, and cryptocurrencies to buy and sell signals right now.
His trading strategies which are based on non-linear dynamic models have achieved more than 65 000 pips of profits since 2015. And right now there are some very strong buy and sell signals across several markets you don’t want to miss.
Want to see which ones?