
03 May 2020 | AtoZMarkets –Pivot points are used by professional traders as a predictive indicator that has a lot of technical significance. In the pivot point, the concept of supply and demand in the market is implemented accurately to provide the maximum benefit for traders.
The pivot point is available free in most of the MT4 and MT5 trading platforms. Moreover, you can download it from MQL5.com for free.
Before proceeding to a trading strategy using a pivot point, let’s see what the pivot point is.
What is Pivot Point?
The high, low, and closing prices of a previous trading session use to calculate the pivot point. In the pivot point, there are three different levels of support and resistance. These resistance levels are known as R1, R2, and R3, while the support level is known as S1, S2, and S3.

If the price moves above the daily pivot point, it indicates that buyers’ are controlling the price. Conversely, if the price is trading below the daily pivot point, it means to initiate short positions. Therefore, support and resistance levels are possible profit-taking zone. Moreover, a break of support or resistance is an indication that the price may move to the next level.
Types of Pivot Points
Before starting to use the indication, it is essential to know the types of the pivot point. There are many types of pivot in forex trading. Among these, we will see the most used types of them-
- Standard Pivot Points
- Fibonacci Pivot Points
- DeMark Pivot Points.
Standard Pivot Points
The calculation of this pivot point formula is the arithmetic meaning of the high (H), the low (L), and the close (C) of previous trading sessions (daily, weekly, monthly).
Therefore, the Pivot point, P = (H + L + C)/3
The calculation of support and resistance is based on the following calculation:
First support: S₁ = 2P – H
First resistance: R₁ = 2P – L
Second support: S₂ = P – D
Second resistance: R₂ = P + D
Fibonacci Pivot Points
The calculation of the pivot point is the same as the standard pivot point. However, the support and resistance levels measure a certain distance from this point P. Let’s call it D – the difference between the high price and the low price. We can subtract multiples of D from P to calculate the support level. Conversely, we can add multiples of D from P to calculate the resistance level. The Fibonacci sequence number indicates the difference between the D and P.
Therefore, the calculations are as follows:
S₁ = P – 0.382D
R₁ = P + 0.382D
S₂ = P – 0.618D
R₂ = P +0.618D
S₃ = P – D
R₃ = P + D
DeMark Pivot Points
This pivot point has different types of calculations. In fact, we can calculate the base pivot point with three different varieties. The calculation method depends on how the close and the open price compare. To calculate the pivot point, we can use a variable x, which depends on whether the opening price is higher or lower than the closing price.
If the closing price is above the opening price: x = 2H + L + C
If the closing price is below the opening price: x = H + 2L + C
When the open is equal to the close: x = H + L + 2C
After having the value for x, we can use it to calculate the base pivot point P:
P = x/4
In this pivot point, there is only one support and resistance levels. We can calculate the support and resistance levels from x
R₁ = x/2 – H
S₂ = x/2 – L
Implement Pivot Point in Forex Trading
In the forex market, the pivot point comes with the concept of supply and demand of a currency pair. As we know, when supply increased, the price starts to fall. On the other hand, price rises with an increase in demand. Therefore, there is a point where supply and demand are almost the same. This is known as an equilibrium point. In the forex chart, the pivot point is used as an equilibrium point from where the price is likely to make a decent movie. So, if the price is above the pivot point and it approaches it again, it is possible the price will start the move again following the direction.
Let’s see a forex trading strategy using pivot point in step by step:
Use the weekly pivot point in the chart to implement the equilibrium point in a higher timeframe. Then move to the hourly timeframe to identify the possible trading entry.
Traders in the weekly timeframes are more potent than the hourly timeframes. Therefore, following them will provide better accuracy trades.
Wait for the Price to Approach Pivot Point
After implementing the pivot point, watch the market until the price reaches toward a pivot point.
For a long trade, the price should be above the pivot point, and it will approach again to the pivot point with a corrective structure.
For a short trade, the price should be below the pivot point, and it will contact again to the pivot point with a corrective structure.
Enter the Trade
To enter the trade, you should focus on how price rejected the pivot point. Any rejection in H1 or even in H4 chart with an appropriate reversal candlestick pattern is effective to enter the trade. Therefore, you should take the trade after closing the candle.
Long Trade
- Price touches the pivot point
- Price bar fails to create new lows and make a rejection
- Price closes with a reversal candlestick pattern and a new high.
Short Trade
- Price touches the pivot point
- Price bar fails to create new highs and make a rejection
- Price closes with a reversal candlestick pattern and a new lows.
In the example shown in the chart below, the bar failed to make a new high at the pivot point and rejected the level with a bullish rejection candle. The entry is when the subsequent price bar creates a new low of the entry bar, and the stop loss should be above the high of candlestick pattern with some buffer.
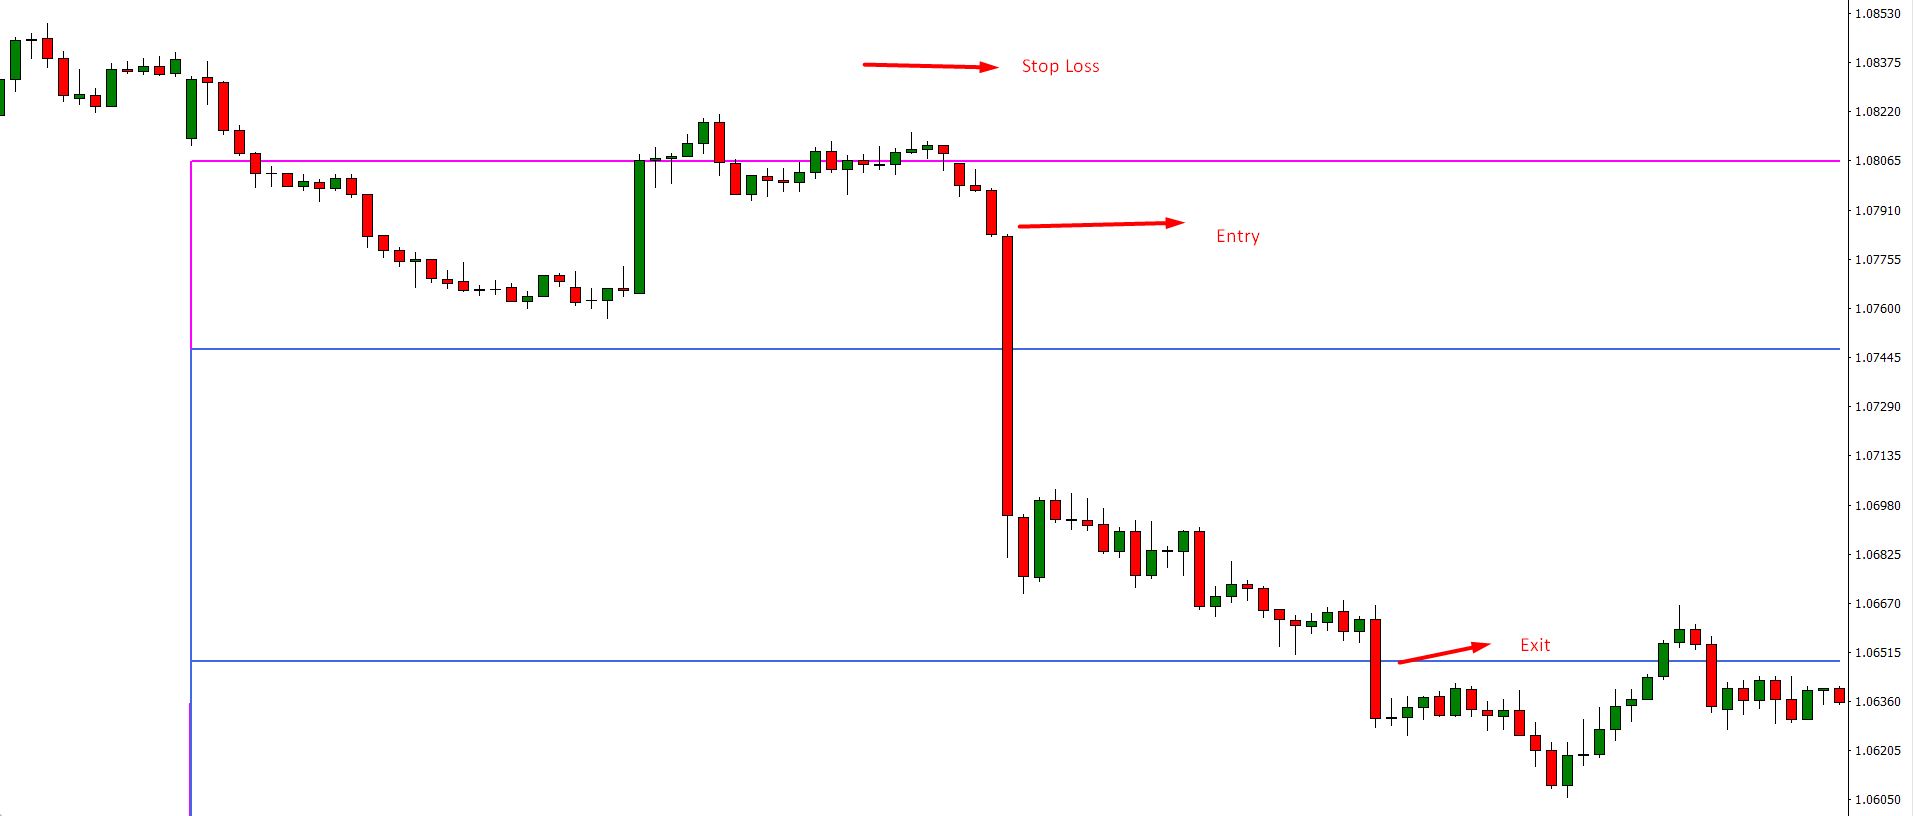
You can adjust stop loss to use either the pivot point as the stop loss or the high or low of the trading entry bar as the stop loss, depending upon the market being traded.
Exit the Trade
Wait for the price to trade at your target level or at your stop loss level. Therefore, either your target or stop loss order to get filled. The pivot point bounce trade can take anywhere from a few minutes to a couple of hours to reach your profit target or stop loss.
Considering the market movement, you can adjust the trade with the next pivot point. Therefore, you can move your stop-loss at breakeven to make the trade risk-free.
Repeat the Trade
You should repeat the trading system on every new week when an appropriate trading environment appears. Make sure that you need to wait with patience to see the excellent trading setup. You cannot force the market to see the perfect structure rather than waiting. If you see any imperfect trading setups to appear, ignore it.
Conclusion
The main risk for most of the retail trading strategy is market volatility. When a market is volatile, you may see the price to violate the equilibrium point along with support and resistance levels. Therefore, you need to avoid market volatility by taking no trades at that time. Otherwise, you can use a smaller lot size and wider stop-loss to avoid unwanted stop- loss hit.
Think we have missed something? Let us know in the comment section below!