


Bitcoin has broken back above $70,000 after its strongest rally in months, forcing traders to reassess a market that had spent much of the summer under pressure.
BTC traded near $72,000 on Thursday after surging almost 9% in the previous session, breaking above $70,000 for the first time since June. The move was driven by a combination of improving liquidity expectations, renewed institutional demand and a sharp short squeeze.
The immediate question is whether Bitcoin can hold the breakout — and whether $80,000 is now within reach before the end of September.
Key takeaways
- Bitcoin has reclaimed $70,000 after a sharp rally fueled by Treasury policy, ETF inflows and short covering.
- The $72,000 area presents an immediate technical test, with $76,000 and $80,000 the next major upside levels.
- Prediction markets remain more cautious than the spot market, suggesting traders are not yet convinced that Bitcoin’s broader bearish trend has fully reversed.
Read abut Bitcoin’s 2026 correction here.
Why is Bitcoin rising?
Bitcoin’s breakout came shortly after the U.S. Treasury announced plans to expand purchases of longer-dated government bonds, doubling the size of its buyback operations from $2 billion to $4 billion.
The move was interpreted by some investors as supportive for market liquidity and helped push longer-term Treasury yields lower. Bitcoin and other risk-sensitive assets rallied shortly afterward.
The policy shift was not the only catalyst.
U.S. spot Bitcoin exchange-traded funds recorded approximately $517 million in net inflows on August 19, according to SoSoValue data, marking their strongest daily inflow since early May.
BlackRock’s IBIT accounted for roughly $285 million of the total, while ARK 21Shares’ ARKB and Fidelity’s FBTC also attracted significant inflows.
That matters because the rally was not driven solely by leveraged traders. Fresh ETF demand suggests institutional investors were also adding exposure as Bitcoin moved higher.
Short sellers then amplified the move.
As BTC pushed through resistance levels that had held for weeks, bearish positions were forced to close, creating additional buying pressure and turning the breakout into one of Bitcoin’s sharpest daily moves of 2026.
Bitcoin technical analysis: $72,000 is the first major test
Reclaiming $70,000 improves Bitcoin’s short-term market structure, but the breakout is not yet completely clear of resistance.
BTC is approaching its 200-day exponential moving average near $72,200, an important longer-term technical level that could determine whether the current rally develops into a more sustained trend reversal.
Bitcoin is already trading above its shorter-term 50-day and 100-day exponential moving averages, strengthening the bullish case.
Momentum, however, is becoming stretched after the rapid move higher. The Relative Strength Index moved into overbought territory during the rally, increasing the possibility that Bitcoin consolidates or pulls back before attempting another breakout.
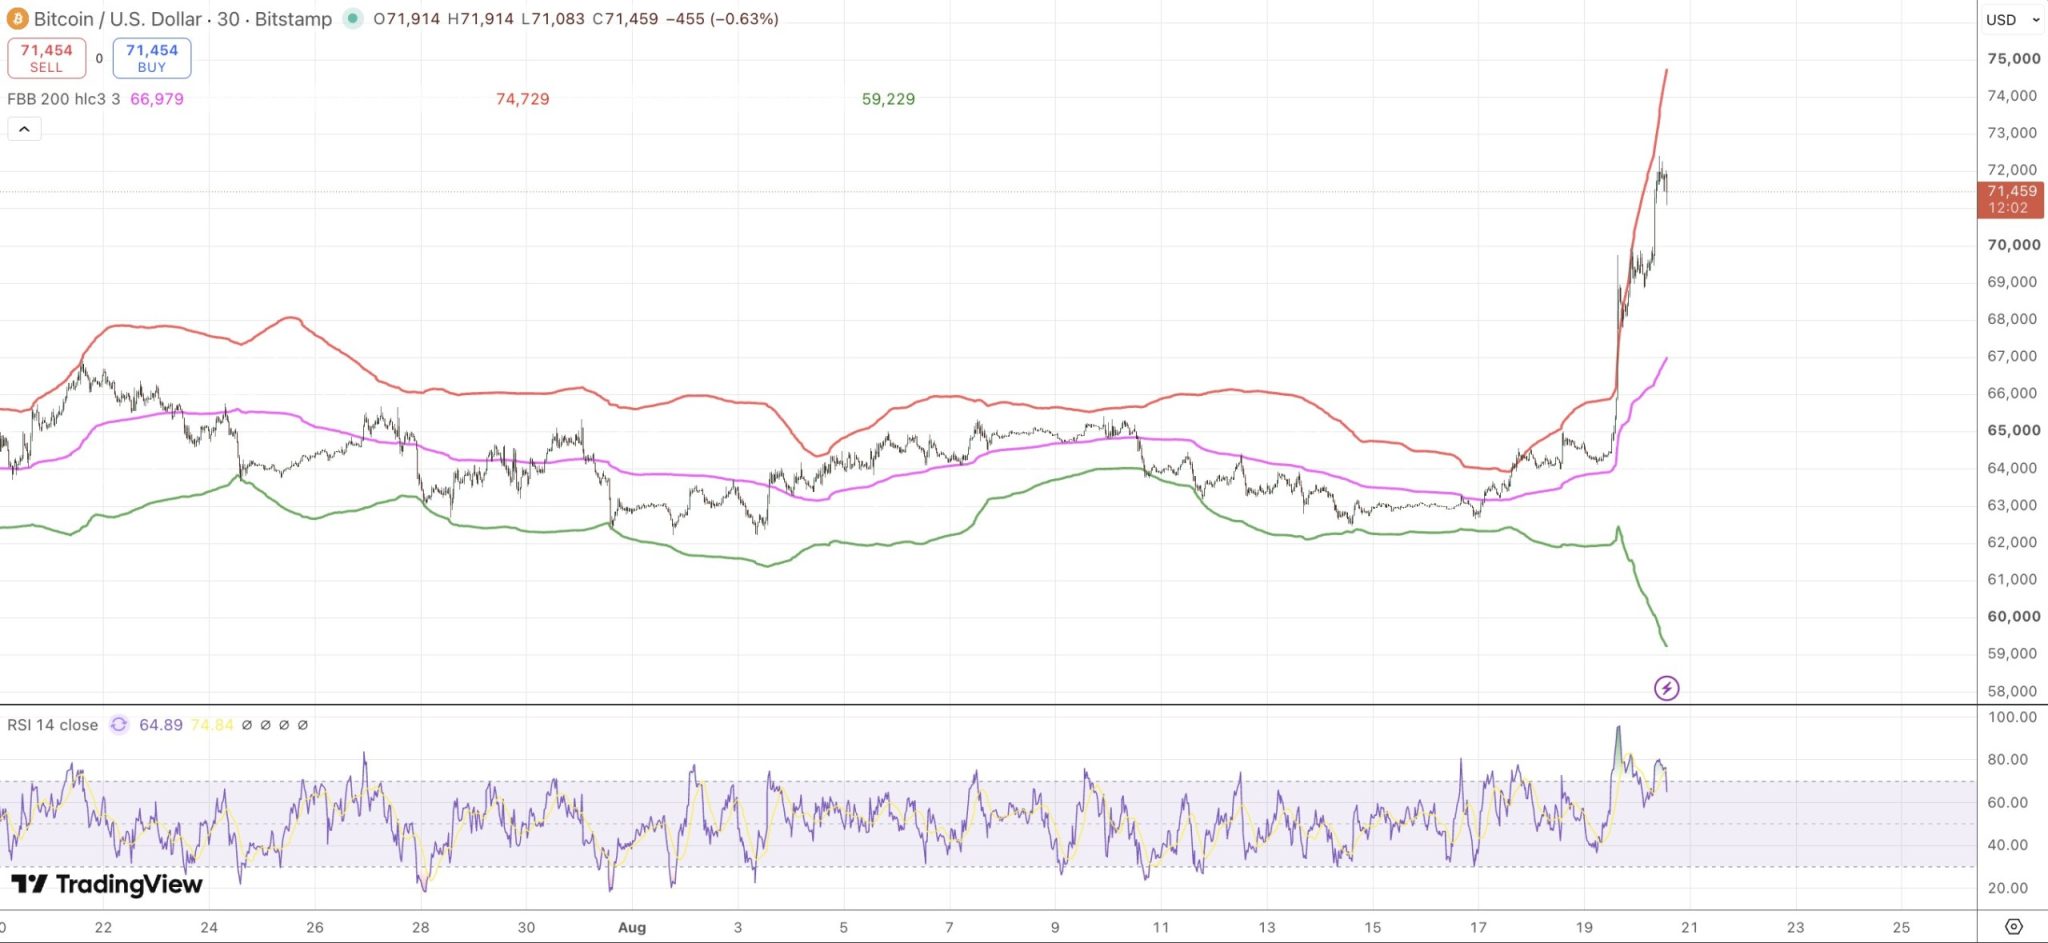
The most important levels to watch are now:
$70,000 — First major support
The former resistance zone is now the first level bulls need to defend. A sustained move back below $70,000 would weaken the breakout and raise doubts about whether the rally can continue.
$72,000-$73,000 — Immediate resistance
Bitcoin is testing its 200-day EMA in this area. A decisive daily close above this zone would strengthen the argument that the medium-term trend is changing.
$76,000 — Major upside target
Previous 2026 highs make the $75,000-$76,000 region the next important test if Bitcoin clears its current resistance.
$80,000 — Psychological resistance
A clean break above $76,000 would put $80,000 in focus. The round-number level is likely to attract both profit-taking and renewed speculative interest.
On the downside, the $63,000-$66,500 region remains a deeper support area should Bitcoin lose $70,000 and fall back into its previous trading range.
Prediction markets remain more cautious
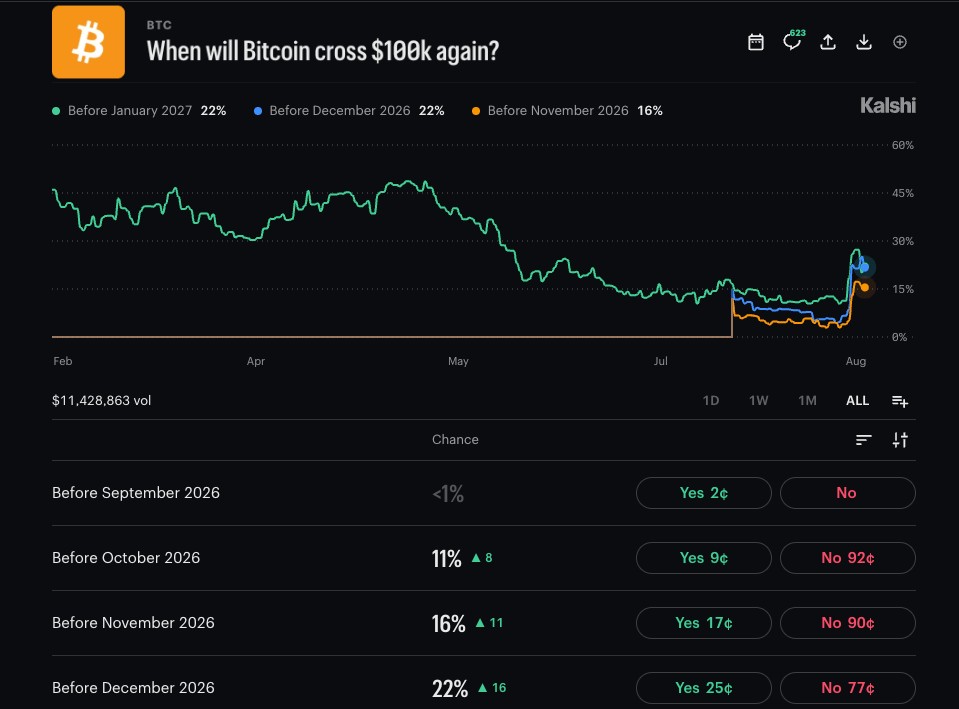
Bitcoin’s spot-market rally has dramatically changed short-term expectations, but traders on prediction markets have not become universally bullish.
That divergence is worth watching.
Before Bitcoin’s breakout, traders on Kalshi were assigning only a 31% probability that BTC would clear $70,000 during August, according to market data cited by Decrypt. Bitcoin subsequently crossed that threshold, illustrating how quickly expectations were repriced by the rally.
On Polymarket, a Bitcoin market with roughly $12 million in trading volume was assigning around a 47% probability of BTC trading above $75,000 during August around the time of the breakout.
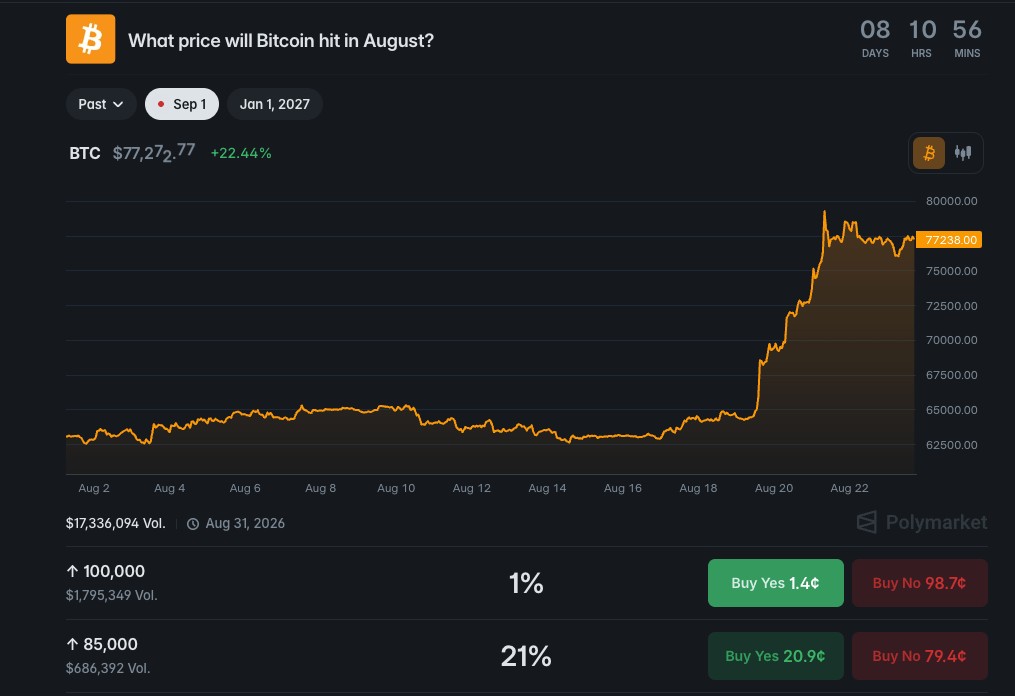
Longer-term expectations remained more divided.
Polymarket’s broader 2026 Bitcoin market had recently priced roughly a 56% chance of Bitcoin touching $55,000 before year-end, while assigning a similar probability to a move toward $75,000.
The takeaway is not that prediction markets are necessarily bearish. Instead, traders appear to be pricing considerable volatility in both directions.
That makes the $75,000-$80,000 zone particularly important. A move through those levels could force another significant repricing across Bitcoin prediction markets, just as the move through $70,000 did.
Read also: Is Polymarket legit?
ETF demand strengthens the bullish case
One of the more constructive signals behind the rally is the return of demand through U.S. spot Bitcoin ETFs.
ETF flows provide a useful measure of investor appetite because they represent capital entering regulated Bitcoin investment products rather than activity solely within crypto-native exchanges.
The approximately $517 million recorded on August 19 therefore provides stronger confirmation of demand than price momentum alone.
If ETF inflows continue through September while Bitcoin remains above $70,000, the probability of challenging $76,000 and eventually $80,000 would increase.
A reversal back into sustained ETF outflows would weaken that argument.
Bitcoin price forecast for September 2026
Rather than relying on a single price target, Bitcoin’s September outlook can be divided into three scenarios.
Bullish scenario: $76,000-$80,000+
Bitcoin holds above $70,000, clears the 200-day EMA and breaks decisively through the $75,000-$76,000 resistance area.
Continued ETF inflows and improving liquidity conditions could then put $80,000 in play, with a move above that level potentially opening a larger continuation.
Base case: $70,000-$76,000
After such a rapid rally, Bitcoin could spend much of September consolidating its gains.
Holding $70,000 while trading below $76,000 would still represent a constructive outcome and allow the market to absorb the recent short squeeze without invalidating the breakout.
Bearish scenario: $63,000-$68,000
A sustained break back below $70,000 would suggest that the move was a failed breakout rather than the beginning of a durable trend reversal.
Under that scenario, Bitcoin could revisit support between approximately $63,000 and $66,500.
What could change the Bitcoin outlook?
Three factors are likely to matter most heading into September.
ETF flows: Continued institutional inflows would strengthen the bullish case, while renewed outflows could remove an important source of demand.
U.S. liquidity and interest-rate expectations: Bitcoin benefited from falling yields and expectations of easier financial conditions. A reversal in those conditions could pressure risk assets.
Prediction-market sentiment: Kalshi and Polymarket markets provide a real-time view of how traders are pricing Bitcoin’s probability of reaching key thresholds. A sustained repricing toward $75,000, $80,000 and beyond would provide another indication that expectations are moving with the spot-market breakout.
Bitcoin outlook: Is $80,000 realistic?
Bitcoin’s move above $70,000 represents a meaningful improvement in market structure, particularly because the rally has been accompanied by renewed ETF inflows and a significant change in macroeconomic sentiment.
But the market still needs confirmation.
The first test is whether BTC can remain above $70,000 and overcome resistance around its 200-day moving average. Beyond that, the $75,000-$76,000 zone becomes the key level separating consolidation from another leg higher.
For now, $70,000-$76,000 remains the most reasonable base-case range heading into September, while a confirmed break above $76,000 would make a test of $80,000 increasingly plausible.
Prediction-market traders remain noticeably less convinced than the recent price action might suggest, making the gap between Bitcoin’s spot rally and the probabilities being priced on Kalshi and Polymarket another signal worth tracking into September.