The harmonic pattern is the price action pattern that consists of trendlines and Fibonacci levels. The unique feature of the harmonic pattern is that it is effortless to plot. There are several types of harmonic patterns that provide both a reversal and continuation signals. In today's lesson, we will see the top 4 harmonic patterns in the forex market.
07 October 2020 | AtoZ Markets – The forex market is the world's biggest financial market. Most of the market participants here are Central Bank, prominent financial institutes, multinational companies, hedge funds, mutual funds, and Forex brokers.
When we talk about Forex trading, we are competing with Big banks and financial institutes. Therefore to remain in the industry with sustainable growth in the trading account, you should follow a trading strategy that has a proven track record. There are many trading strategies in the world, and most of them are profitable.
However, identifying the reliable one and implementing it in the chart is essential. The harmonic pattern is a trading strategy that is providing profitable trade since 1932. Therefore, if you are trading with the harmonic pattern trading strategy, you are following a system that has a long history of valuable years.
What is the Harmonic Pattern?
A harmonic pattern is a trading tool that is created from the geometric calculation and Fibonacci ratios. Traders use these rules as both market continuation and reversal indicators. There are two types of harmonic patterns in the financial market. The first one is an internal pattern, and the second one is the external pattern.
The internal pattern is a geometric shape where the price moves within the form. Example of external patterns is Gartley patterns and Butterfly patterns.
Like other external patterns, a Gartley is profitable, and it has years of history to provide a decent trading result.
Trade safely with any of these AtoZ Approved brokers for free:


History of Harmonic Pattern
The harmonic pattern became popular among traders in recent years. These patterns are names from mostly animal-like Shark, crab, and bat.
HM Gartley First introduced this pattern in his trading book profits in the stock market, page number 222. This book was published in 1935. Later on, Larry Pesavento Discovered this matter as the Gartley 222 pattern. Furthermore, in the late 90s, Bryce Gilmore used the X- ABCD pattern with geometry and Fibonacci levels.
Later, many patterns were added in the list of harmonic databases. The Bat pattern and the Crab pattern were added between 1998 to 2001. During this time, traders started to use harmonic patterns with an appropriate ratio and standard formation.
Based on the historical evolution, we can see that a single person's harmonic pattern was not developed or only time. From its introduction, it was developed by several traders in time, and still, the harmonic pattern is emerging. There are lots of harmonic patterns in the world, and we will see the top for harmonic patterns suitable for the forex market.
Top 4 Harmonic Patterns
Here is the list of top 4 harmonic patterns in the forex market:
- Bat Pattern
- Butterfly Pattern
- Crab Pattern
- Gartley Pattern
Let's have a look at these in detail:
Bat pattern
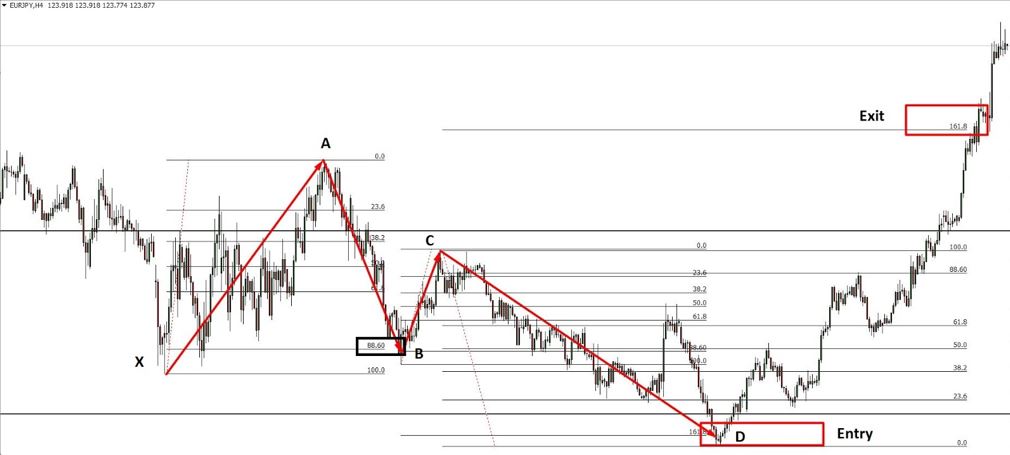
Bat pattern has four legs- XA, AB, BC, and CD legs. To identify this, you should draw trendlines and use Fibonacci levels.
In the image below, we can see how a Bat pattern looks like:

Let's see how Bat pattern forms in the market-
- XA- it is the first leg. If the current market trend is bearish, the XA will move upside. On the other hand, if the current market trend is bullish, XA will move bearish.
- AB- The second leg is AB that forms after XA leg. The point of the AB leg can retrace from 0.382 to 0.50 to the XA leg. If the XA move is primarily impulsive, then AB should be corrective.
- BC- It is the second impulsive move towards the direction of XA. However, the price will remain indecisive as it will not create any new higher or lower low. Therefore, BC will retrace 0.382 to 0.888 of XA leg.
- CD- CD leg is the last leg of the Bat pattern, which indicates the entry point. CD leg should extend 1.618 to 2.618 of BC leg, where the point D is the entry point.
Butterfly Pattern
The butterfly pattern works as a market reversal indicator.
It is usually seen at the top and bottom of the price. Therefore, the bearish butterfly pattern forms at the top of the market and bullish butterfly forms at the bottom of the market.
This pattern also has four legs- XA, AB, BC, and CD, where the point at X is the starting point, and point D is the trading entry point.
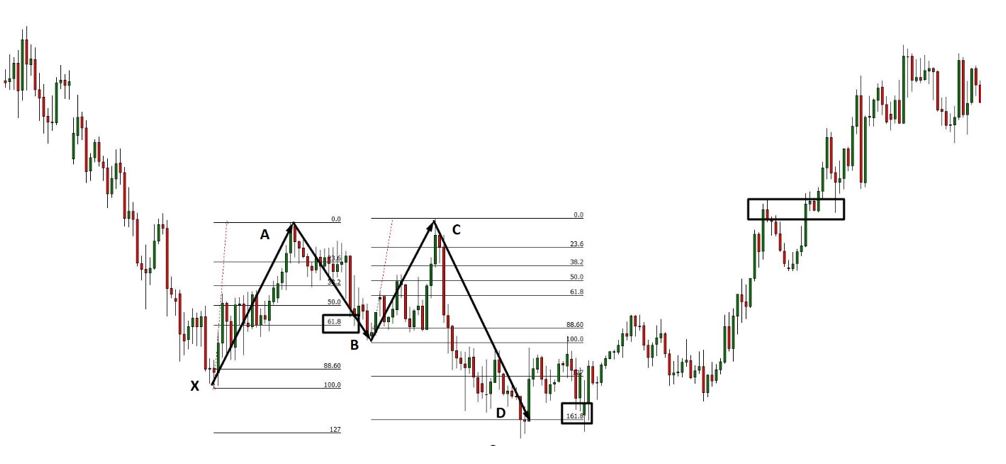
Let's have a look at how the Butterfly pattern looks like-
- XA= XA is the primary leg.
- AB= AB retraces 78.6% of XA leg.
- BC= BC should retrace from 38.2% to 88.6% of AB.
- CD= extends up to 161.8% and even 261.8% of BC.
Look at the image below to see how a butterfly pattern looks like:

Crab Pattern
Crab pattern also forms with the trendline and Fibonacci calculation, which is similar to the other harmonic patterns.
Let's have a look at what the legs of a Crab pattern represent:
- XA= XA is the primary leg.
- AB= AB retraces 38.2% to 61.8% of XA leg.
- BC= BC should retrace from 38.2% to 88.6% of AB.
- CD= CD leg can move 224.0% to 361.8% Fibonacci extension level of BC
The image below represents the Crab pattern.

Gartley Pattern
The Gartley pattern is similar to the other harmonic pattern forming with the combination of the trendline and Fibonacci ratios. It is easy to plot in the chart as it requires only to draw a trendline and Fibonacci levels. These trading tools are free and available in most of the trading platforms.
The Gartley trading pattern looks like the W/M shape. Like the butterfly pattern, it has four legs- XA, AB, BC, and CD.
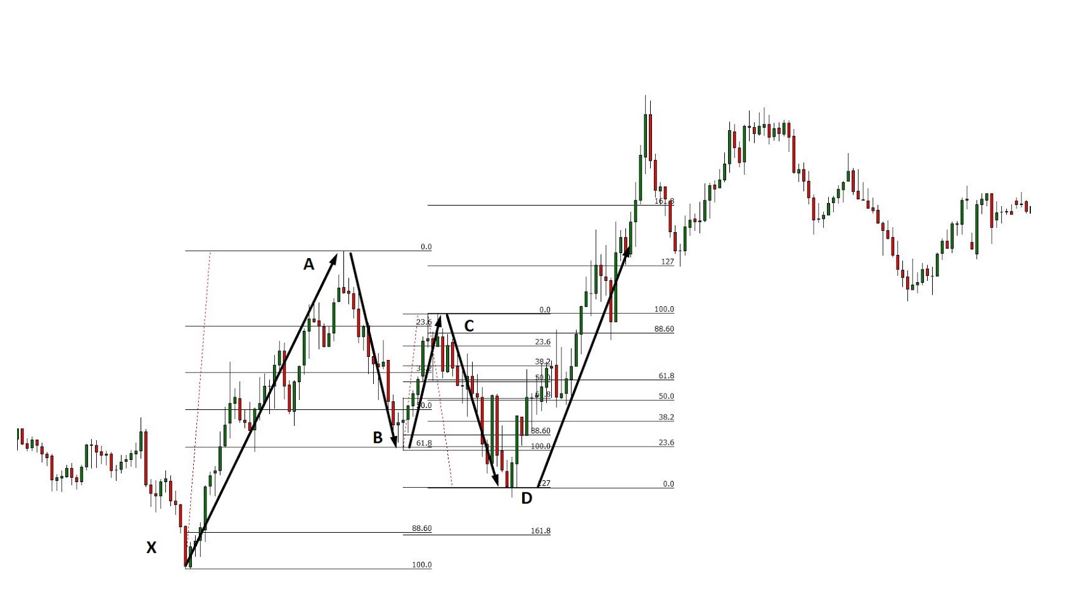
Let's have a look at the components of the Gartley harmonic pattern:
- XA= XA is the primary leg.
- AB= AB retraces 61.8% of XA leg.
- BC= BC should retrace from 38.2% to 88.6% of AB.
- CD= CD leg can move 127.2% Fibonacci extension level of BC
The image below represents the Gartley pattern.

Like the top 4 harmonic patterns and want to try them out? Do it with an AtoZ Approved broker for free:


Conclusion
In the above section, we have seen the top 4 harmonic patterns in the forex market. These patterns are very profitable for traders, and it doesn't require any complicated calculation.
However, the forex market consists of some unavoidable risks. Therefore, to remain unbeaten in the industry, traders should follow a proper trade management system to minimize the overall risks.
Also, if you want to learn more about patterns, don't forget to read our candlestick patterns cheat sheet.
Should you use these harmonic patterns on your own at all?
Before you start using a harmonic pattern, you'll want to read this.
Our in-house trading expert Dr Yury Safronau, PhD in Economic Sciences, gives you daily his best stocks, forex and cryptocurrencies to buy and sell signals right now. And it's not just based on a simple singular backtested strategy.
His trading approach which is based on non-linear dynamic models has achieved more than 65 000 pips of profits since 2015. And right now there are some strong buy signals across several markets you definitely don't want to miss.
Want to see which ones?
Think we have missed something? Let us know in the comment section below!


