
Some professional Forex trader finds forex volatility studies and correlation data for Forex trading very useful. Here is How to Use Forex Volatility Data.
AtoZForex – Whether you are a professional trader or a beginner trader Forex volatility studies and correlation data helps to gain more profits. Forex volatility data seem daunting and confusing, but they are not. In fact, being aware of the average daily volatility data can be very helpful. Here, in this article, I am going to explain to you ”How to Use Forex Volatility Stats”.
How to Use Forex Volatility Data?
First of all, What is Volatility? – Volatility is a statistical measure which indicates a size of changes in a security’s value. Moreover, it is an important financial barometer, which causes an amount of risk when a trading instrument is used over a certain period of time. Currency pairs with a low volatility are less risky as their values do not fluctuate often. A high volatility signifies that a market price can change greatly over a short period of time in either direction.
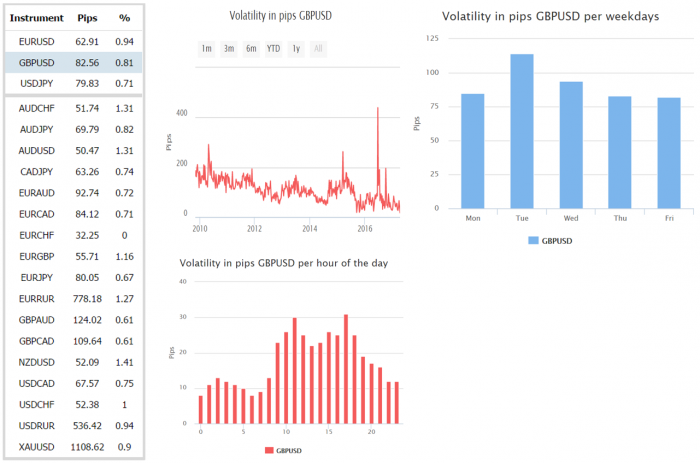
There are three main sections: a summary of the average daily volatility of various currency pairs, and if you click on a particular currency pair you get additional charts (in this case the GBPUSD) which show volatility in pips, Volatility in pips per weekdays, volatility in pips per hour of the day. You can use MT5 Forex volatility calculator to get the data or there are various other calculators available in the market.
How to use forex volatility stats
After you get the data for the currency pair, follow the step-by-step instructions.
- Changes in volatility can be used to confirm changes in directions. Determine bullish and bearish trends.
- Volatility often related to a change in the direction. Therefore, increasing volatility is usually seen during corrections within trends and in trend reversals.
- During a trend, volatility may be steady or decline. If the trend accelerates we see a rise in volatility. This can be a confirmation or a signal the market is nearing a turning point.
- The number of pips a currency pair moves in the day can provide you a lot of information about where to place profit targets and stop loss.
- Volatility can let you know when you should be trading when you should not. Day traders are especially susceptible to the cost of paying the spread, and when volatility drops so does profit potential.
- The GBPUSD may move 120 pips per day, but may only be moving on average 90 pips during the US session, or 87 pips during the European session. If day trading, be aware of the specific stats for the time of day you are trading.
- Apply an Average True Range (ATR) indicator to your charts and this will likely provide you with all the volatility information you need.
- If using an ATR, you can quickly change the time frame of your chart to weekly. The ATR reading will provide you the average movement in the pair for a one week period. This is helpful for swing traders in helping to establish a time frame of when profits or stops may hit.
- Volatility is always changing. Thus, it is important to keep update figures and be aware of changes in volatility if strategies are sensitive to these changes.
What do you think about How to Use Forex Volatility Data? Let us know in the comments section below.