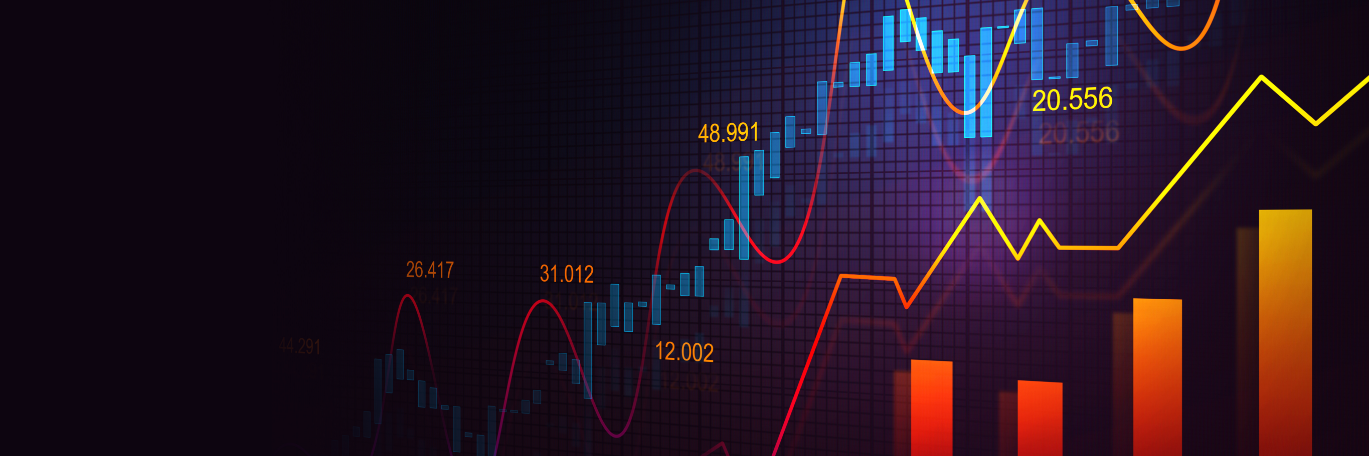
Technical analysis is the most reliable methods of forecasting the performance of various financial instruments, including currencies and stocks. There are three primary instruments used in the field of technical analysis such as lines (levels) pattern (models) and indicators.
The calculation of all indicators is based on certain mathematical formulas that utilize either trading or price volume of a financial instrument. With the help of indicators, traders are able to detect short- and medium-term shifts in the direction of price.
In addition, indicators may give traders with the following details:
- Resistance and support levels (Moving averages Bollinger bands, Envelopes etc.)
- Current market conditions are either flat or trend (Moving averages parabolics, Ichimoku, etc.)
- The strength of trend or momentum. If an indicator increases it indicates that the trend is developing and it is recommended to place your bets in the trend direction. If an indicator drops indicates that traders are losing the interest in financial instruments and a change in trend could occur in the near future (momentum indicator)
- Trading volumes (Accumulation/Distribution, On balance volume, etc.)
Different Types of Forex Indicators
There are a variety of indicators, including trends, volatility and momentum, strength, and many more. But they all belong to the bottom of the barrel or the elite group:
1.) Lagging Indicators: Lagging indicators track trends and are referred to as trend indicators. They are not very prognostic qualities. The most well-known and well-known indicator of lagging is Moving averages or Bollinger bands. The most important characteristic of the lagging indicators is the fact that they function well in a market that is in a state of flux.
2.) Leading Indicators: The indicators that are leading are typically known as oscillators. These types of indicators are used to predict the reversal of trends. They are not able to outdo price changes and new information in the market. They have a tiny forward shift that can be used to predict the future direction of market behavior. Oscillators typically have more false signals than indicators of trends. The most popular oscillators comprise Stochastics indicator as well as RSI.
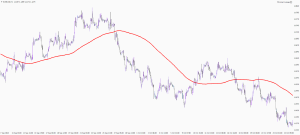
Simple Moving Average (SMA)
One of the most simple and popular trend indicators is the Simple Moving Average (SMA). It appears on the chart like a straight line. It shows the today’s price (closing or opening, etc.) with the previous price for some duration (an an average). It is a good indicator to use for a line of trend however, there are numerous different ways this indicator could be utilized. You can refer to the class known as “Moving Averages in Action”.
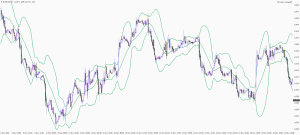
Bollinger Bands Indicator
The Bollinger bands indicator accurately shows the degree of volatility. It is comprised from three lines
– Simple Moving Average (SMA to cover 20 consecutive days);
– Upper band: SMA 20 + (standard deviation x 2);
– Bottom band: SMA 20 – (standard deviation x 2).
Bollinger Bands is a perfect volatility indicator that narrows as well as expands creating an equilateral price structure. Following each narrowing of the channel it expands and the price is able to move rapidly either up or down. So, following each narrowing it makes sense to be patient and wait for the expansion.
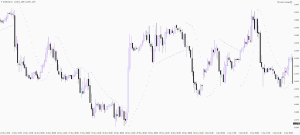
Forex Trend Indicator: Parabolic SAR
Parabolic SAR (Stop and reverse) is an indicator of trend, and is used to identify price Reversals. It is a trend indicator that can be used to spot reversals. Parabolic SAR indicator offers the signals as described below.
- Trend Confirmation:
- Indicator is located beneath the price chart. It confirms that there is an uptrend.
- The indicator is just above the price chart, it indicates the presence of a downward trend.
- Definition of Moments of Closing Forex Positions:
- If price falls below the indicator during an uptrend, long positions must be ended.
- If price rises above the indicator during an uptrend, short positions must be put to rest.
Understand How Forex Indicators Work
Indicators are essential tools of analysis in technical terms for traders who are active. To begin using one of the indicators or other first, it is important to know how it functions and what it is employed for. Since the market’s condition is a factor, trends indicators Volume indicators or oscillators are a possibility.
After you have gotten an understanding of Forex indicators, it’s time to use these indicators. On MT4 or MT5, you’ll access all of the widely used Forex indicators to help you to be more successful.
The risk involved with forex trading online shouldn’t be overlooked. There is a chance of losing a significant amount of money if you don’t know what you’re doing. It is crucial to gain a knowledge of the market prior to you even begin investing with money. Keep reading our lessons.