Chart patterns are graphical representations of price movements on a chart. Technical analysis suggests that history often repeats itself, meaning that traders may encounter certain price patterns that have occurred in the past. This provides an opportunity to predict future price movement based on past patterns. These models are called chart patterns, and there are two main types: reversal patterns and continuation patterns. Some of the most popular chart patterns are described below.
The Head and Shoulders Pattern
The Head and Shoulders Pattern (H&S) is formed by three consecutive peaks. The side peaks are shoulders, and the middle one is the head. Between those peaks, there are local minimums, which form a support level. This level is called the “neckline” of the Head and Shoulders model.
On the chart below, you can see a classic example of the Head and Shoulders reversal pattern. The main components are easy to see: two shoulders, a head, neckline (which acts as support level before breakout and resistance level afterwards).
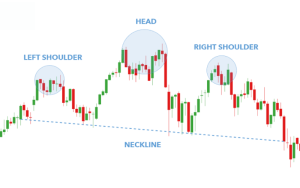
The head and shoulders pattern is a reversal pattern that can signal the end of an uptrend and the beginning of a downtrend. If this pattern forms in a bullish market, traders should expect the trend to become bearish. Similarly, if the market is in a downtrend, the inverse head and shoulders pattern may form, indicating a potential reversal to an uptrend.
The pattern doesn’t just signal that the trend is shifting it also gives you the possibility to trade. The most straightforward method of trading between the Shoulder and Head is to trade immediately after the shoulder that was created (or purchase in the case of the reversed head and shoulder). The Take Profit Target is calculated as follows to subtract neckline levels from the peak of the head. You set the take profit level to the exact amount of pips to your neckline. If you missed the chance to buy immediately after the price broke the neckline, you should keep an eye on the price to retest this level later on.
The Double Top and the Double Bottom Formations
Tops, bottoms and doubles is one of the most sought-after easy to apply, profitable patterns that are widely used among Forex traders.
This Double bottom pattern is reminiscent of the letter “W” and the Double top looks like”M” in the letter “M”. The idea behind these patterns is very similar to the shoulder and head, however instead of three peaks , these models have just two.
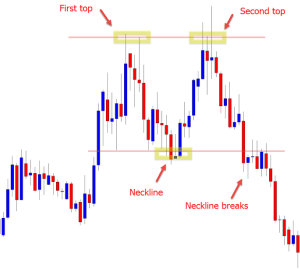
It is known as the Double Top is a bearish pattern that reversals upon an upward trend. Price is unable to break a important support levels. The tops are about the same in height. However, there must have an improvement in the volume of trading after the first peak has created. The traders are waiting for the breakout of the support line after the second peak before they begin opening sell entries.
It is also known as the Double Bottom. Double Bottom is a bullish reverse pattern. It appears like an exact mirror image of that of the Double top pattern and functions exactly the same way.
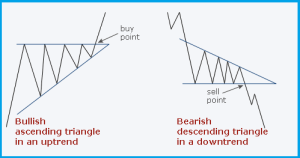
The Ascending and the Descending Triangles
It is believed that the Ascending Triangle pattern develops when price has a series of lower sloping lows with similar highs. Also, the Descending Triangle pattern is formed when price creates a sequence of higher sloping highs as well as similar lows. If you connect highs and lows with two lines, the triangle will be created. The Ascending and Descending triangles are patterns that continue the trend.