There are different types of Forex charts that you need to be aware of if you want to be successful in the world of Forex trading. In this lesson, we will discuss the four most common types of Forex charts and what they represent. We will also provide some tips on how to use each type of chart to your advantage. So, whether you are a beginner or an experienced trader, read on to learn more about Forex charts.
Types of Forex Charts
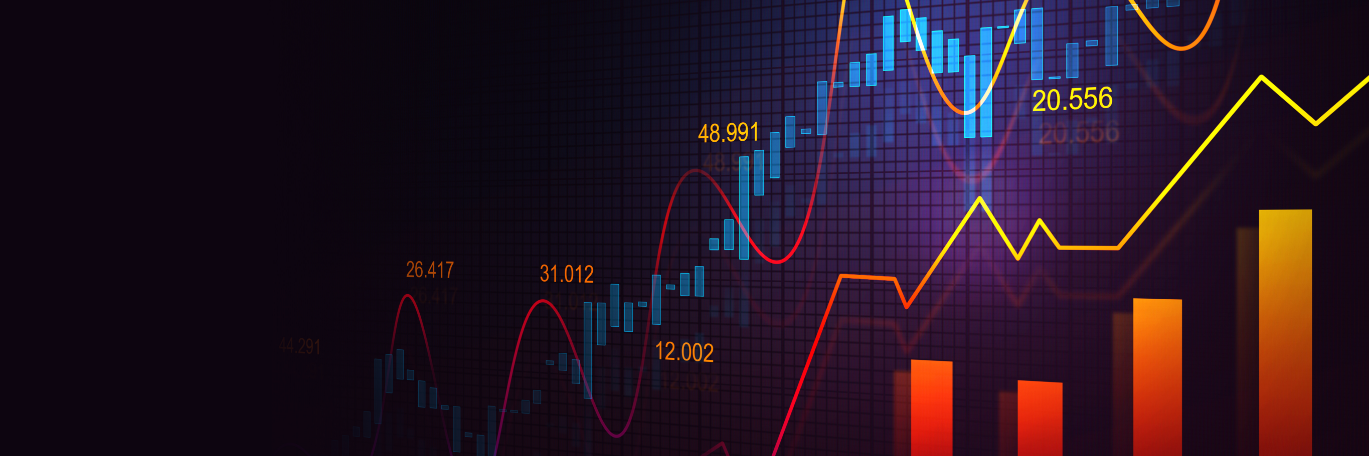
There are three kinds of Forex charts that are commonly employed by Forex traders in technical analysis.
- Line chart
- Bar chart
- Candlestick chart
- Renko Chart
In the sub-heading below, we’ll go over each Forex chart type, and also explain what you need to know about each type.
Line Chart
The first type of Forex chart is the line chart. This type of chart is created by connecting a series of data points together with a line. Line charts are used to track the price movement of a currency pair over time.
Forex line chart is a type of chart which displays information as a series of data points called “ticks”. It is similar to other financial charts, such as stock charts, but there are some important differences. One of the most important differences is that forex line charts can be used to track currency pairs.
Another difference is that the forex line chart only displays closing prices, while other charts may also include opening, high and low prices. This makes the forex line chart more suitable for short-term trading strategies, such as scalping.
Lastly, the forex line chart can be customized to show different time frames, from one minute to one month. This makes it possible to find patterns and trends that would be difficult to spot on other types of charts.
If you are new to forex trading, or if you are looking for a simpler way to trade, a forex line chart may be the right choice for you. Try it out and see how it can help you make better trades.
Another important difference is that a forex line chart can be used to track currency pairs. This means that you can see how two different currencies are performing against each other. This can be helpful in making decisions about which currency to buy or sell.
Additionally, forex line charts only display closing prices. This can be beneficial if you are only interested in short-term trends and do not need opening, high, or low prices. Forex line charts can be customized to show different time frames, from one minute to one month. This allows you to find patterns and trends that might be difficult to spot on other types of charts.
Bar Chart
The second type of Forex chart is the bar chart. The Bar chart is a very popular type of forex chart among traders. It displays the high, low, open and close price for the currency pair you are trading. The “OHLC” in its name stands for “open, high, low, close”.
Many traders find this type of chart very useful because it provides a lot of information in a single glance. For example, you can easily see the price range for the day as well as the opening and closing price.
If you are just starting out in forex trading, we recommend that you use the Bar chart to get a better understanding of how prices move. As you become more experienced, you can try other types of charts to see which one works best for you.
Candlestick Chart
The third type of Forex chart is the candlestick chart. The candlestick chart is easy to interpret because it shows the market sentiment for a specific time period. For example, if the candlestick is red, it means that the price went down during that time period. If the candlestick is green, it means that the price went up during that time period.
The candlestick chart can be used to find trends and reversals. A trend is when the price is moving in a certain direction over a period of time. A reversal is when the price changes direction.
Candlesticks are often used in conjunction with other technical indicators to make trading decisions. However, they can also be used alone to find potential trades.
If you’re just starting out in forex trading, candlestick charts can be a helpful tool. They are easy to read and can give you a good idea of what’s going on in the market. Just remember that they are only one tool and shouldn’t be used alone to make trading decisions.
Renko Chart
The fourth and final type of Forex chart is the Renko chart. Renko chart is a type of chart, developed by the Japanese, that is built using price movement rather than both price and time. In a Renko chart, time does not matter. The line on the chart will form bricks or candlesticks only when the price moves up or down by a predefined amount. This makes it easy to spot trends as well as reversals. Renko charts can be applied to any timeframe from intraday charts to monthly charts.
The key benefits of using Renko charts are that they:
-Are easy to construct and interpret
-Can be used for day trading, swing trading or long-term position trading
-Filter out small price movements which makes it easier to identify trends
-Make it easy to spot reversals
-Are not affected by time
There are a few drawbacks of using Renko charts which are:
-They can be lagging as they only form when the price moves by a certain amount
-The bricks can be of different sizes which can make it difficult to compare one brick to another
-They can sometimes give false signals in a choppy market
Overall, Renko charts are a helpful tool that traders can use to make better informed decisions. While there are some drawbacks, the benefits outweigh the negatives and Renko charts should definitely be considered as part of your trading arsenal.
So, there you have it. These are four of the most common types of Forex charts that you need to know about. Be sure to experiment with all of them to see which one works best for your trading style. And remember, the more you know about Forex charts, the better equipped you will be to make successful trades.
Now that we’ve gone over the different types of Forex charts, let’s talk about how to use them to your advantage. As we mentioned before, line charts are helpful in identifying trends and support and resistance levels. Bar charts can be useful in identifying reversals and breakouts. And candlestick charts can provide more information at a glance. But no matter which type of chart you use, remember to always keep an eye on the price action! Price action is the key to success in the world of Forex trading. So, be sure to keep an eye on it at all times.
Do you have any questions about using Forex charts? Leave a comment below and let us know! We would love to hear from you.
The risk involved with forex trading online shouldn’t be overlooked. There is a chance of losing a significant amount of money if you don’t know what you’re doing. It is crucial to gain a knowledge of the market prior to you even begin investing with money. Keep reading our lessons.