


Gold had a big run at the start of 2026. The price climbed fast in January, then cooled off. Since then, it has moved sideways. If you are new to trading gold, this back and forth can feel confusing. Here is a simple look at what is happening and what to watch next.
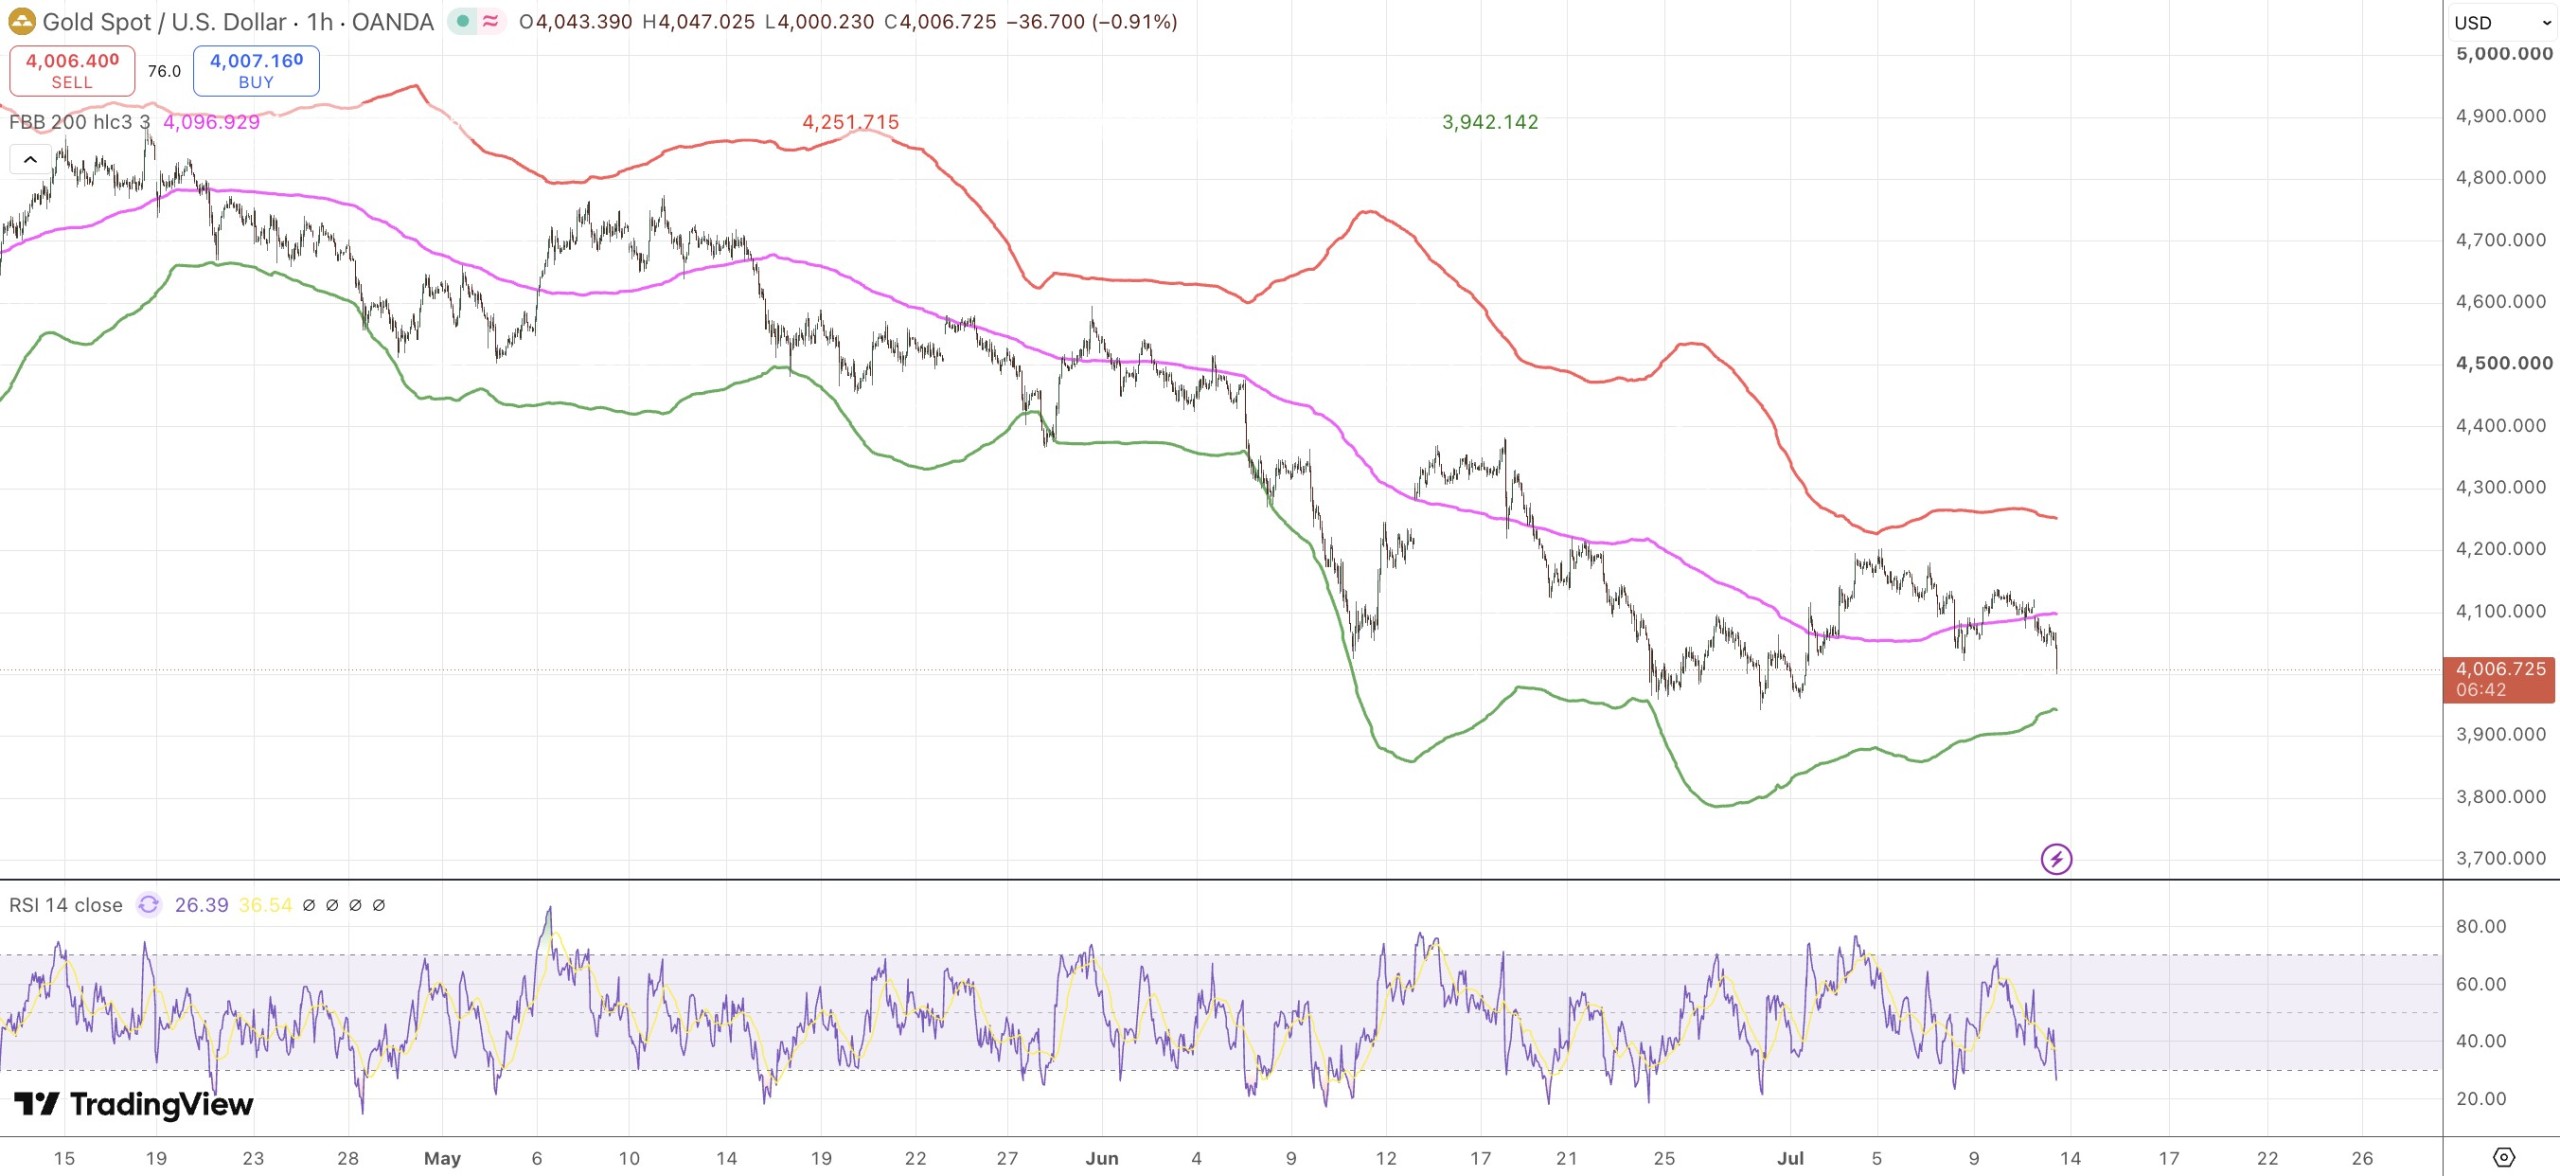
Right now, gold sits in a tight zone. The price is trading above its 200-day average, near $4,340. But it has not been able to break past its 50-day average, near $4,730. Think of these two lines as a floor and a ceiling. Gold is stuck between them for now.
Technical picture
Earlier this year, gold dropped to a low of about $4,170. That level acts like a safety net. If the price falls again and holds above $4,170, buyers may step back in. If gold breaks above $4,730 instead, it could signal the next move higher. Watch these two levels closely if you trade this pair.
What is driving demand
Central banks buy a lot of gold, and that demand affects the price. Reported buying looked weak in early 2026, and Türkiye even sold some of its gold. But other data suggests real buying was stronger than reported, especially from China. New rules also let Chinese insurance firms hold gold, which could add more demand later.
The biggest risk to gold is the US Federal Reserve. If inflation stays high and forces the Fed to raise rates again, gold could lose some of its shine. Higher rates make gold less attractive since it does not pay interest.
For now, watch the Fed’s next moves and how central banks behave. These two factors will likely decide where gold goes by the end of the year.