
27 November 2019 | AtoZ Markets – Forex Chart patterns are one of the most effective trading tools for a price action trader. The patterns are usually forms on the basis of underlying buying and selling pressure. Forex Chart patterns have a proven track record. Traders use them to identify continuation or reversal possibilities with proper target levels.
What are Chart Patterns?
Chart patterns are basically the graphical formations of the price. The price pattern occurs by the price movement with a series of trend lines and curves.
When a price pattern indicates a trend reversal, it is called a reversal pattern, while the continuation pattern happens when the trend continues in the same direction. Price action traders mainly use price patterns to forecast future market movement. This is one of the handiest tools that have a proven track record.
However, not only forex, Chart patterns are a very common way to trade any type of financial instrument like stocks, indices or cryptocurrencies.
The most profitable chart pattern gives the graphic representation of the buyers’ and sellers’ activity in the market. They also display the relative strength of the definite price levels. There are many patterns that the trader uses in the forex market.
Let’s have a look at the top 5 of them.
Trade Forex safely with an AtoZ approved broker:
Top 5 Forex Chart Patterns You Should Know
The chart pattern is the set of trend lines that are used for predicting the price. Chart patterns are more reliable than other traditional indicators. There are continuations & reversal chart patterns. We will see the top 5 Forex chart patterns which cover both reversal & continuation pattern.
Head & Shoulder Pattern
Head and shoulder represent an indication of possible price reversal. Therefore, if a trader sees this pattern in the chart, he may think that the current underlying trend is about to change. The head & shoulder price pattern includes three swing highs where the middle swing high is the highest than the other two.
The first swing high represents the running trend, while the middle swing high represents the continuation of the first swing high. However, the third swing high indicates that the price is no longer wish to continue further. Therefore, the price formed as ahead with a right and left shoulder.
The neckline is a trendline connecting the two shoulders on the opposite side of the swing highs. The neckline is an essential part of the pattern, which completes the pattern if price breaks below it. In that case, a trader finds a selling signal after breaking the neckline with a candle close to the following time frame with a retest.
The primary profit target for this pattern is the distance between the top of the head and the neckline. On the other hand, stop loss will be above the swing high of the rejection candle from the neckline with some buffer.
The Head and Shoulder pattern usually represents the end of a bullish trend and the start of a bearish trend. However, the same pattern applies to the bullish trade setups, named as reversal Head & Shoulder Pattern.
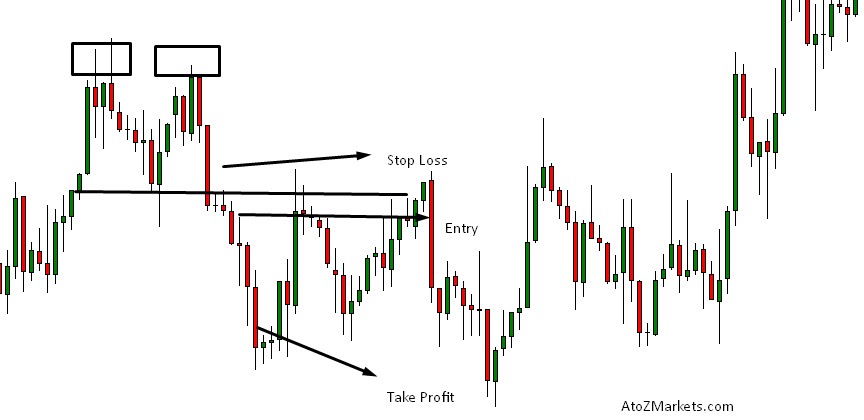
Double Top and Double Bottom
Double Top and Double Bottom are another popular forex reversal chart patterns. Like head & shoulder, this pattern occurs for both up-and downtrend. A double top has two swing highs at the same levels or slightly different prices.
The first high indicates the current trend and the second high represents that the buyers lose momentum to continue the current bullish pressure. As the price fails to make a new high, the possibility increases for potential price reversal. Like the neckline in the head and shoulder pattern, there is a support level below the two top levels. The selling signal appears when the price breaks below that support level with some retest. In that case, the profit target would be 100% of the range between the support and the top.
The double bottom pattern is the opposite, with two swing lows. The second low indicates that the sellers do not have the power to drag the price down. The bullish signal appears as soon as the price breaks the resistance with some retest. Moreover, the profit target would be 100% of the bottom to resistance and the stop loss will be the lower of the rejection candle with some buffer.
Try this forex reversal chart pattern with an AtoZ Approved broker for free:
Triple Top & Triple Bottom Pattern
Triple Top and Triple Bottom patterns are quite similar, like the double top and double bottom patterns. However, instead of two tops, the triple top pattern should have three tops. The main interesting thing about the triple top is that it indicates a stronger possibility of the price reversal than the double tops. It is quite easy to understand that if a price rejects level three times rather than two; there will be a higher possibility of the price to move towards the opposite direction. With the triple top pattern, traders may have better accuracy of their analysis.
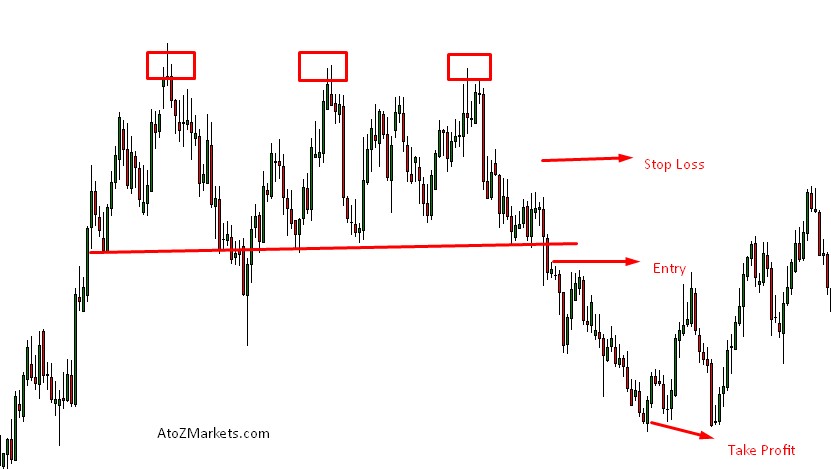
However, to enter the sell, the trader should wait for a break below the support with a candle close and a correction. The target and stop loss will be the same as double top patterns. Moreover, this pattern also applies to a more bullish and bearish market scenario.
Forex Chart Patterns Wedge Pattern
A wedge is a continuation pattern. A bullish wedge forms in an uptrend, as the price starts doing correction inside converging trendlines. This converging trendline indicates that the sellers are trying to push the price down, but they do not have enough strength. As a result, the price formed as a correction to indicate the continuation of the bullish trend.
Therefore, buyers win when the price breaks through the upper trendline. In that case, the target would be towards the maximum height of the wedge from the breakout point. In addition, the stop loss would be the lowest peak of the wedge.
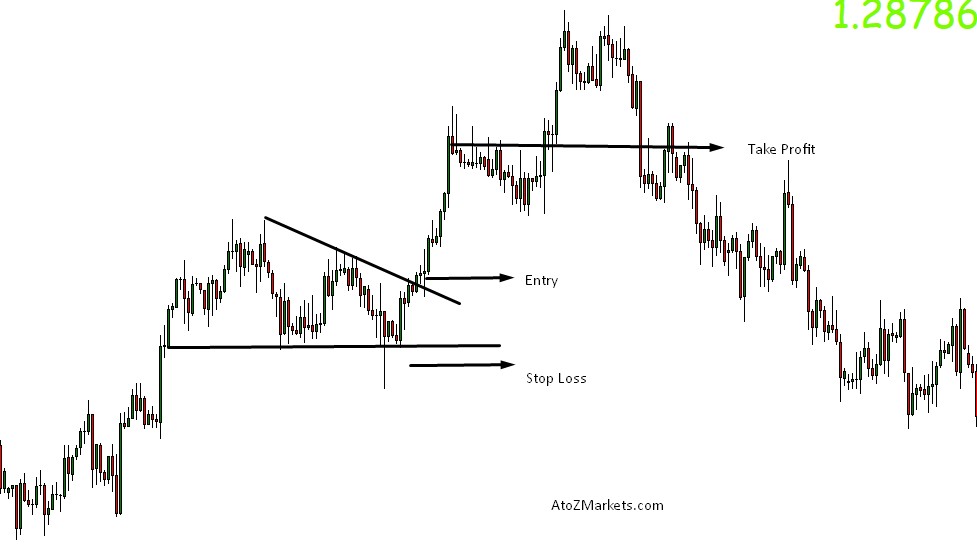
The bearish wedge is almost the same as the bullish wedge. However, the main difference is that the slope of the bearish wedge would be up. The converging trendline will indicate that the buyers’ are interrupting the downtrend but do not have enough momentum. Therefore, the price breaks below the wedge to indicate the bearish continuation. The target price is, like by bullish wedges, the height of the wedge from the point of breakout.
Triangle Pattern
Triangle is also a continuation pattern. There are three types of a triangle- ascending, descending and symmetrical.
All types of triangles look similar. However, the ascending triangle has a flat upper trendline while the descending triangle a flat lower trendline. The symmetrical triangle is slightly exceptional. It forms during both up-and downtrends. Like wedge patterns, It has converging trendlines, but the slope is neither pointing up or down. The symmetrical triangle forms when there is confusion between the buyers and the sellers. Therefore, the price starts correcting by squeezing between the triangles.
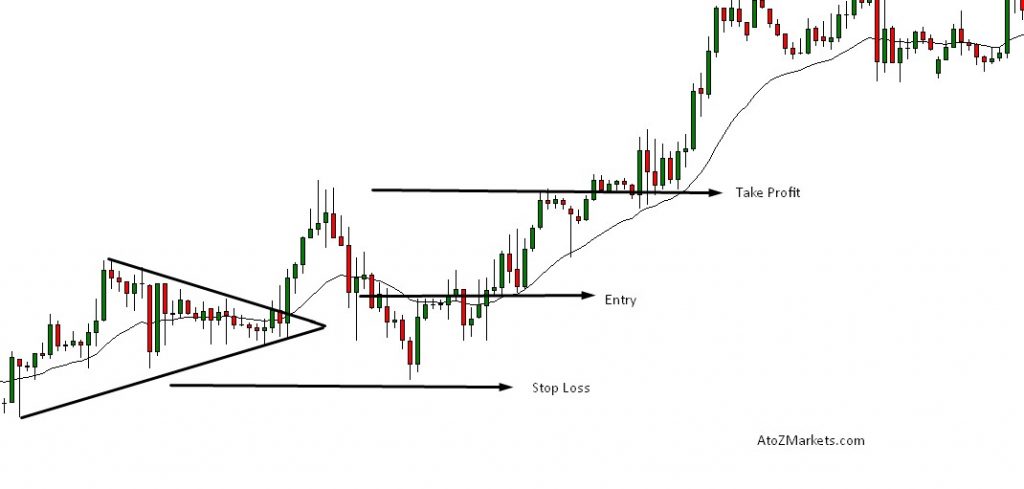
If the breakout happens below the lower trendline, the price will continue the downtrend. On the other hand, if the breakout happens above the trendline, the price is most probably starting a bullish movement. However, a successful triangle breakout happens only towards the current trend. The profit target for the triangle breakout will be the difference between the highest and the lowest price within the triangle pattern. On the other hand, the stop loss should be the nearish support or resistance level from the breakout area.
Like these forex reversal chart patterns and want to try them out? Do it with an AtoZ Approved broker for free:
Conclusion Final Thoughts of Forex Chart Patterns
We all know, in the forex market, we only trade the probabilities. No one in the world can give a 100% guarantee of a price movement. Using the chart patterns as a part of the price action trading is just to increase the probability. Moreover, the forex market is ever-changing. Therefore, it is also important to know when the pattern will work and when not.
Yes, it’s all about market context. In the nonvolatile market, there will be a continuation of the current trend. On the other hand, in the volatile market, there will be many false breakouts to confuse the traders. Therefore, traders should consider some preconditions before patterns trading:
- Understand the market context before entering any trade based on a chart pattern.
- While drawing the pattern feels very comfortable. If the trendline does not match like the theoretical ones, do not force them. Only pick the patterns that normally formes.
- For setting the stop loss and take profit always, consider the important support and resistance levels.
- Lastly & most importantly, manage your trade. However, it is the hardest part for a trader to control emotions while trading and maintaining good money management formulas.
Don’t forget to check our candlestick patterns cheat sheet. Pattern trading is a part of the price action trading. A perfect pattern may enrich your trading career.
Should you use Forex chart patterns on your own at all?
Before you start trading with chart patterns, you’ll want to read this.
Our in-house trading expert Dr Yury Safronau, PhD in Economic Sciences, gives you daily his best stocks, forex and cryptocurrencies to buy and sell signals right now. And it’s not just based on a simple singular backtested strategy.
His trading approach which is based on non-linear dynamic models has achieved more than 65 000 pips of profits since 2015. And right now there are some strong buy signals across several markets you definitely don’t want to miss.
Want to see which ones?
Think we missed something? Let us know in the comments section below.