Reversal strategies suggest that markets tend to revert, i.e. a negative movement will be followed by a positive movement, and vice versa. To examine whether markets tend to be trend revert or trend succeed (i.e. a positive movement is followed by a positive movement and a negative movement also by a negative one), we need to check historical prices for evidence of such behaviour. Then, we need to examine whether this behaviour is more likely to occur compared to a random selection, such as a coin toss.
To do this, we first need to understand the notion of probability. In general, probability is the possibility of an event occurring, expressed as a percentage of total possible events. For example, the probability of tossing a coin and getting heads is the possibility of that event, i.e. 1 out of the 2 possible outcomes (heads or tails). Thus, the overall probability is ½ or 50%. In a similar setting, the probability of getting the number 12 in the roulette is 1 out of a total of 36 outcomes, hence the probability is 1/36, i.e. about 3%.
An interesting complication of probabilities is that if they are independent, i.e. if the previous outcome does not affect the current outcome, such as in coin tossing, roulette, and the lottery, then we can simply multiply the events to get total probability. For example, the probability of getting two consecutive heads is ½ multiplied by ½ which gives us a total probability of ¼ or 25%. This is useful in understanding how often price movements can be viewed as random or as following a statistical pattern.
To elaborate on this, I have employed EURUSD data to examine whether there is evidence of a reversal activity in the pair. As the table below shows, there is evidence of such behaviour only in the 1-minute chart, where reversals are observed in the data. Otherwise, the percentage of trend reversals appears to be very close to 50%, i.e. being random.

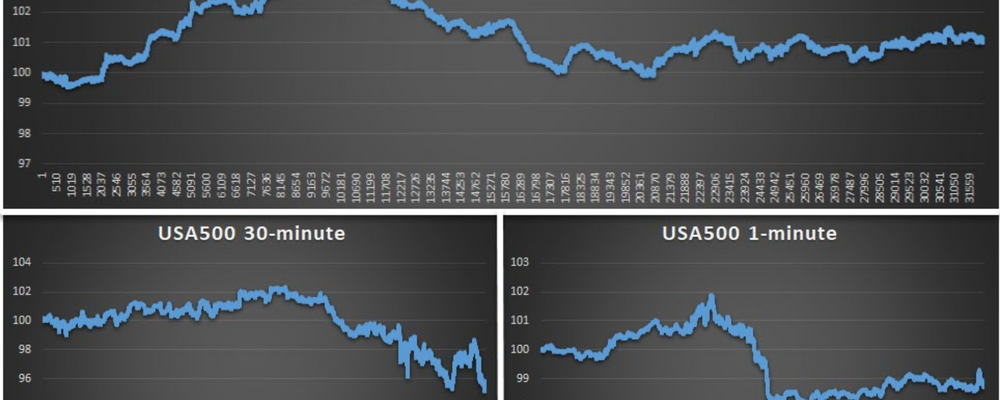
The same holds for the USA500 index as the table below shows, albeit it suggests that reversal strategies can be non-random at the 30-minute interval as well. However, despite their statistical appeal, these strategies are not as successful as expected. As the graph in the start of this post shows, the strategy can be successful during some periods while it can be terribly disastrous in others. For example, while it worked for the 1-minute chart in the EURUSD, at times very successful, reaching gains in excess of 3%, it dropped to just above 1% in the end.

The USA500 1-minute and 30-minute charts record a similar response: the 30-minute chart, when the probability is closer to 50%, records much worse performance, while the 1-minute chart provides a good start but ends in disappointment.
So what does this tell us? Like all trading strategies, reversal strategies can be successful in some instances and unsuccessful in others. The analytics above suggest that reversal strategies are unsuccessful in longer horizons and hence there appears to be no reason to follow such a strategy. In contrast, 1-minute charts allow for a better implementation of such strategies, as historical data show. The success of the strategy appears to be more pronounced in the EURUSD case, albeit also having its ups and downs. Consequently, in addition to specifying a correct timeframe, traders need to be very careful in drafting their strategy and adjust it quickly to how the market reacts. Remember that no strategy is full-proof and fast adjustment is something which can make or break a trade.