


Position sizing separates traders who survive drawdowns from those who blow their accounts. The Kelly Criterion offers a mathematical answer to the question every day trader eventually asks: how much of my capital should I risk on this trade?
Developed at Bell Labs in 1956, the formula calculates the optimal bet size based on your actual win rate and average payoff ratio. This guide covers the Kelly formula, step-by-step calculations, worked examples for forex and crypto traders, and the practical adjustments that make the theory usable in live markets.
Your capital is at risk. This article is for educational purposes and does not constitute financial advice.
What is the Kelly Criterion
The Kelly Criterion is a formula that calculates the optimal percentage of your trading account to risk on a single trade. John Kelly developed it at Bell Labs in 1956 to solve signal noise problems in telecommunications, but gamblers and traders quickly recognized its value for sizing bets. The formula balances two competing goals: growing your account as fast as possible while avoiding the kind of oversized bets that can wipe you out during a losing streak.
So why does position sizing matter so much? Risk too little on each trade, and your account grows painfully slowly even when your strategy works. Risk too much, and a few consecutive losses can set you back months or blow your account entirely. The Kelly Criterion attempts to find the mathematical sweet spot between these extremes.
For day traders specifically, the formula takes your actual trading statistics and converts them into a concrete percentage. Rather than guessing or using arbitrary rules like “risk 2% per trade,” Kelly uses your win rate and average win-to-loss ratio to calculate a position size tailored to your specific edge.
The Kelly formula for position sizing
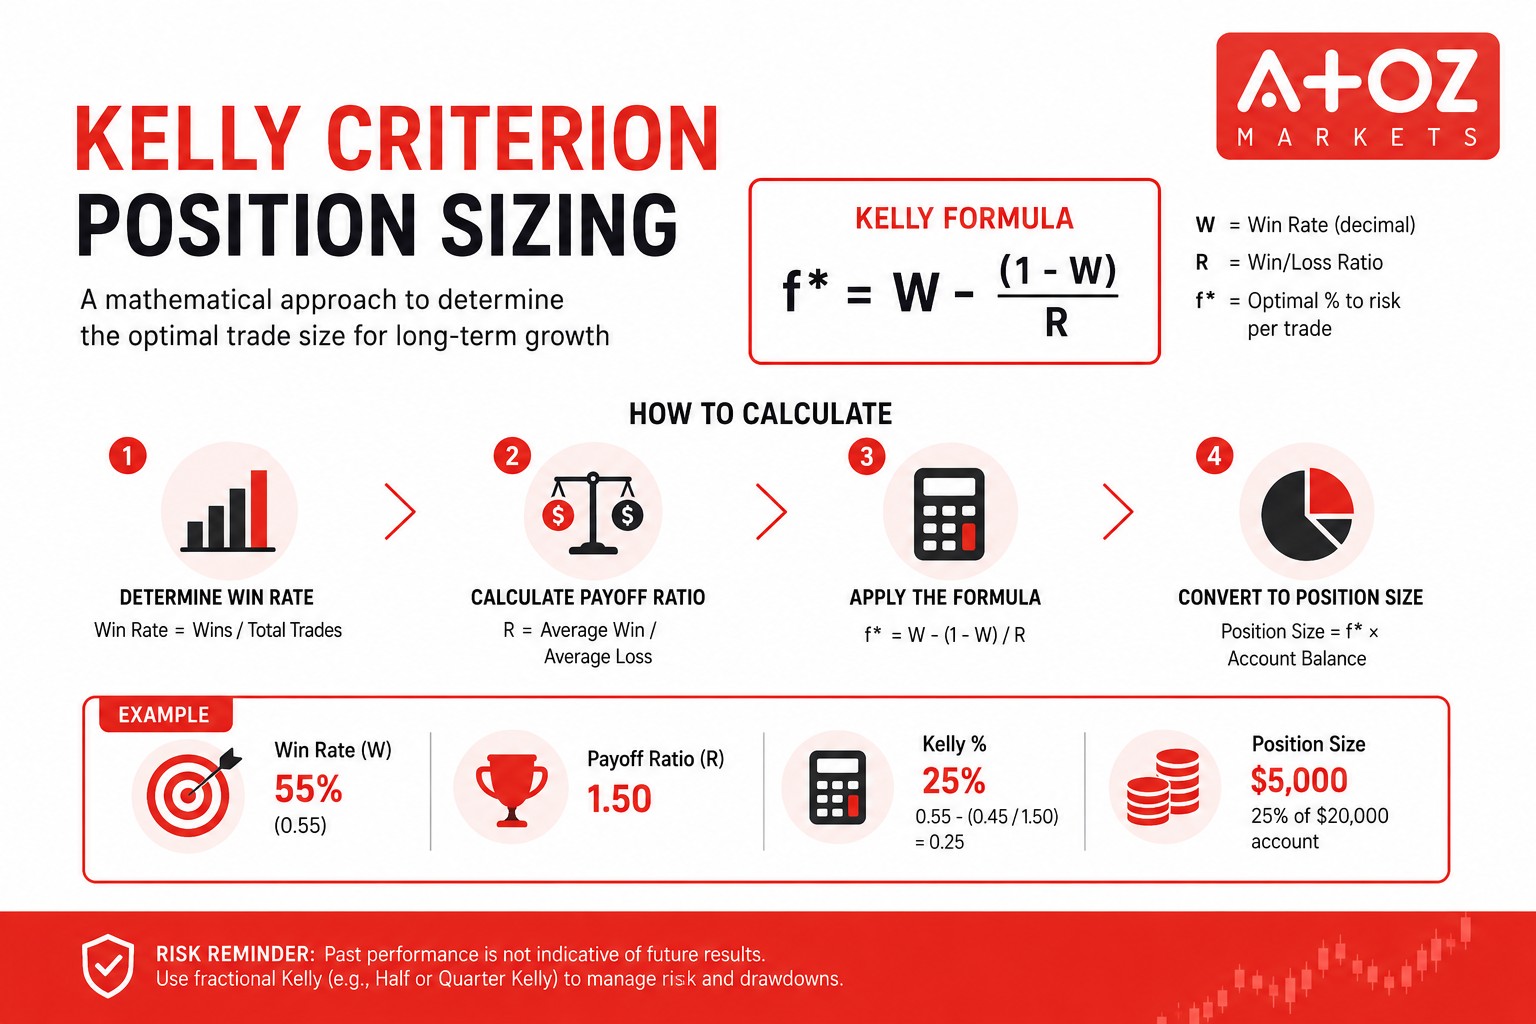
The formula itself looks straightforward:
Kelly % = W – [(1 – W) / R]
Two variables drive the entire calculation, and both come from your own trading history.
Win probability variable
“W” represents your win rate, expressed as a decimal. If you win 55 out of every 100 trades, your W equals 0.55. This number comes directly from your trading journal or broker statements, not from backtests or hypothetical scenarios.
Win-loss ratio variable
“R” is your payoff ratio, which compares how much you make on winning trades versus how much you lose on losing trades. Calculate it by dividing your average winner by your average loser. If your average winning trade nets $300 and your average losing trade costs $200, your R equals 1.5.
Complete formula breakdown
When you combine both variables, the formula produces a percentage. A positive result means you have a statistical edge worth exploiting. A negative result, or zero, indicates no edge exists, and the formula is essentially telling you to stay out of that particular trade or strategy.
- Positive Kelly %: You have an edge, and the percentage tells you how much to risk
- Negative Kelly %: No edge exists, so risking capital makes no mathematical sense
- Zero Kelly %: Break-even expectancy, meaning no advantage to trading
How to calculate Kelly Criterion position size
Walking through the calculation step by step makes the formula practical rather than abstract.
Step 1. Determine your historical win rate
Pull your trade history and count winners versus total trades. The sample size matters here. Calculating from 15 trades produces unreliable estimates, while 50 to 100 trades starts to offer statistical meaning. If you’ve taken 80 trades and won 44 of them, your win rate is 44 ÷ 80 = 0.55.
Step 2. Calculate your average payoff ratio
Add up all your winning trades and divide by the number of winners to get your average win. Do the same for losers. Then divide average win by average loss.
For example, if your total profits from winners equal $9,000 across 44 winning trades, your average win is $204.55. If your total losses equal $5,400 across 36 losing trades, your average loss is $150. Your payoff ratio R equals $204.55 ÷ $150 = 1.36.
Step 3. Apply the Kelly formula
With W = 0.55 and R = 1.36, the math works out like this:
Kelly % = 0.55 – [(1 – 0.55) / 1.36]
Kelly % = 0.55 – [0.45 / 1.36]
Kelly % = 0.55 – 0.33 = 0.22
The result suggests risking 22% of your capital per trade.
Step 4. Convert percentage to dollar position size
Multiply the Kelly percentage by your account equity. With a $10,000 account and a 22% Kelly result, the formula suggests a $2,200 risk per trade. However, as we’ll cover shortly, most traders use a fraction of this figure because full Kelly creates significant volatility.
Kelly Criterion trading examples for day traders
Seeing the formula applied to different markets helps clarify how the inputs shape the output.
Forex day trading example
A forex trader running a EUR/USD strategy has logged 200 trades with a 55% win rate and a 1.5 payoff ratio.
Kelly % = 0.55 – [(0.45) / 1.5] = 0.55 – 0.30 = 0.25
On a $20,000 account, full Kelly would suggest risking $5,000 per trade. Most traders would find that figure uncomfortably aggressive, which is why fractional Kelly exists.
Crypto day trading example
A crypto trader focusing on BTC breakouts has a lower 40% win rate but captures larger moves, producing a 3.0 payoff ratio.
Kelly % = 0.40 – [(0.60) / 3.0] = 0.40 – 0.20 = 0.20
| Factor | Forex Example | Crypto Example |
|---|---|---|
| Win Rate | 55% | 40% |
| Payoff Ratio | 1.5 | 3.0 |
| Kelly % Result | 25% | 20% |
Notice how a lower win rate can still produce a meaningful Kelly percentage when the payoff ratio compensates. The formula weighs both factors together, so a trader who wins less often but wins bigger can have a similar edge to someone who wins frequently but captures smaller moves.
Why day traders use Kelly Criterion
Three practical benefits explain why Kelly appeals to active traders.
Maximizes long-term capital growth
Kelly is mathematically designed to grow accounts faster than any other fixed-fraction betting system over time. According to QuantConnect’s research on the topic, “The Kelly criterion is a mathematical formula that determines the ideal size of a bet to maximize long-term capital accumulation.”
Removes emotional position sizing
After a winning streak, traders often increase size recklessly. After losses, they shrink positions out of fear. Kelly replaces emotional swings with a consistent, data-driven framework that stays the same regardless of recent results.
Scales with account size automatically
Because Kelly uses percentages rather than fixed dollar amounts, position sizes naturally grow as your account grows. During drawdowns, positions shrink automatically, providing built-in risk reduction when you can least afford large losses.
Full Kelly vs fractional Kelly in day trading
Here’s where theory meets reality. Full Kelly often produces position sizes that feel too aggressive for most traders, and the math backs up that instinct.
When to use full Kelly
Full Kelly maximizes theoretical growth but creates significant equity volatility. Drawdowns can exceed 30-40% even with a genuine edge. Full Kelly suits traders with extremely high confidence in their edge estimates and a tolerance for watching their account swing dramatically.
When to use half Kelly
Half Kelly is the most commonly recommended approach. According to tastylive’s research, using half Kelly “reduces the risk of large drawdowns (e.g., 38% for full Kelly vs. 22% for Half-Kelly)” while still capturing most of the growth benefit. For most traders, half Kelly offers a reasonable balance.
When to use quarter Kelly
Quarter Kelly suits traders who are uncertain about their edge estimates or prefer smoother equity curves. The tradeoff is slower account growth in exchange for reduced volatility and smaller drawdowns.
| Kelly Fraction | Growth Potential | Drawdown Risk | Best For |
|---|---|---|---|
| Full Kelly | Highest | Highest | High-confidence edge |
| Half Kelly | Moderate | Moderate | Most traders |
| Quarter Kelly | Lower | Lowest | Conservative approach |
Tip: Starting with quarter or half Kelly allows you to test the formula’s output against your actual risk tolerance before committing to larger position sizes.
Read also: Fixed Fractional Position Sizing for Traders: Strategy Breakdown
Limitations of Kelly Criterion for day traders
No position sizing method is perfect, and Kelly has notable blind spots worth understanding before you apply it.
Requires accurate win rate estimates
The formula’s output is only as reliable as its inputs. Overestimating your win rate by even a few percentage points can lead to dangerously oversized positions. Garbage in, garbage out applies directly here.
Does not account for correlated positions
Kelly assumes each bet is independent. Day traders who open multiple correlated positions simultaneously, like going long EUR/USD and long GBP/USD at the same time, may stack risk beyond what the formula accounts for. Both positions can move against you together.
Ignores psychological drawdown limits
The mathematically optimal size might exceed what you can emotionally tolerate. A 30% drawdown might be acceptable on paper but devastating in practice, leading to strategy abandonment at the worst possible time.
Common Kelly formula trading mistakes
Even traders who understand the formula often stumble in its application.
Using insufficient sample size
Calculating Kelly from 20 trades produces unreliable estimates. You typically want 50-100 trades minimum before the statistics become meaningful. Fewer trades means your win rate and payoff ratio might not reflect your true edge.
Ignoring changing market conditions
Your edge from a trending market may evaporate in a ranging environment. Win rates and payoff ratios shift over time, and your Kelly inputs require periodic recalculation to stay relevant.
Over-leveraging with full Kelly
Combining full Kelly with leveraged instruments amplifies both gains and losses. A 25% Kelly position on a 10:1 leveraged forex trade creates exposure far beyond what the formula intends.
How to track your Kelly Criterion inputs
Consistent data collection makes Kelly practical rather than theoretical.
Trading journal best practices
For each trade, record entry price, exit price, P&L, and outcome. Many brokers offer built-in journaling tools, or spreadsheet templates work fine. The key is consistency, because gaps in your data undermine your calculations.
- Entry and exit prices: Allows you to verify P&L calculations
- Dollar P&L: The raw number for calculating averages
- Win or loss: Binary outcome for win rate calculation
- Date and time: Helps identify if your edge varies by session or market condition
Minimum sample size guidelines
Plan to recalculate your Kelly inputs periodically. Monthly, quarterly, or after every 50-100 trades all work as reasonable intervals. Markets evolve, your execution improves or degrades, and your edge changes accordingly.
Smarter position sizing for day traders starts here
The Kelly Criterion offers a mathematically grounded approach to position sizing, though practical application typically involves using fractional Kelly to manage volatility. Start by tracking your trading metrics consistently, calculate your inputs from meaningful sample sizes, and consider beginning with half or quarter Kelly as you build confidence in your edge estimates.
For ongoing forex and crypto market coverage to help inform your trading decisions, AtoZ Markets provides timely news and analysis across both markets.
FAQs about Kelly Criterion for day traders
Can I use Kelly Criterion if I do not have historical trade data?
No. The formula requires historical win rate and payoff ratio data to function. Without it, paper trading to gather statistics or using a conservative fixed-percentage model of 1-2% per trade makes more sense until you’ve built a sufficient data set.
How often should I recalculate my Kelly percentage?
Recalculating monthly, quarterly, or after every 100 trades helps account for evolving market conditions and changes in your strategy’s performance. Your edge is not static.
Does Kelly Criterion work for scalping strategies?
Yes, Kelly applies to any strategy with a measurable edge. However, scalpers typically generate larger sample sizes quickly, which actually makes their Kelly estimates more reliable faster than swing traders.
What is the minimum number of trades needed for accurate Kelly inputs?
While no universal threshold exists, 50-100 trades is often cited as a reasonable minimum for statistical reliability. Fewer trades produce estimates that may not reflect your true edge.
Can I apply Kelly Criterion to multiple simultaneous positions?
The standard formula assumes single, independent bets. For multiple correlated positions, reducing total exposure proportionally helps avoid over-risking capital when positions move together.