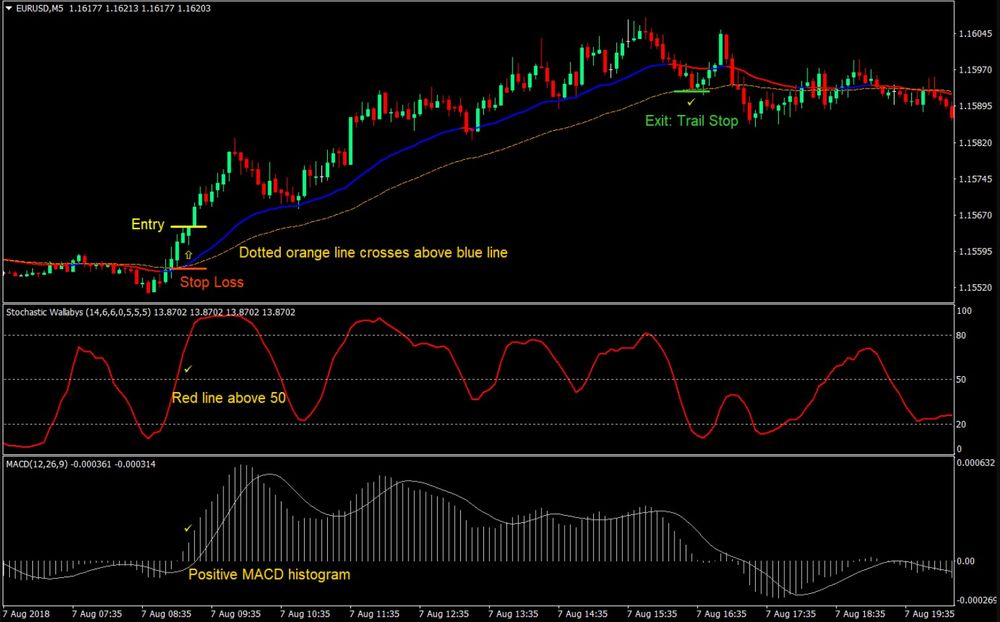
VR Moving Average Forex Trading Strategy is a day trading strategy that is traded on the 5-minute chart. While some would consider the 5-minute chart as a scalping timeframe, this strategy allows for trades which could be held for quite some time but seldom goes beyond a day.
One is a variation of the stochastic oscillator, the Stochastic Wallabys. This will be used by looking at the position of the indicator line relative to its midline. Above 50 means the market is bullish. Below 50 means the market is bearish.
A couple of indicators to be used are based on moving averages, the i-AMA-Optimum, and the vr_moving_average. These indicators will be used as a trigger. Crossovers going up should generate a buy while crossovers going down should generate a sell signal.
Lastly, a standard MACD indicator will be used as a filter. Positive histograms mean the market is bullish while negative histograms mean the market is bearish.


Indicators:
- vr_moving_average
- i-AMA-Optimum
- Wallaby
- MACD
Timeframe: 5-minute chart only
Currency Pair: preferably EURUSD and GBPUSD
Trading Session: London and New York Session
How to trade with VR Moving Average Forex Trading Strategy?
Buy (Long) Trade Setup
Entry
- The blue line of the vr_moving_average should cross above the dotted orange line of the i-AMA-Optimum indicator
- The Stochastic Wallaby indicator should be above 50
- The MACD histograms should be positive
- Enter a buy market order at the confluence of the above rules
Stop Loss
- Set the stop loss below the dotted orange line
Exit
- Trail the stop loss below the dotted orange line until hit
- Close the trade manually if the MACD histogram becomes negative
Sell (Short) Trade Setup
Entry
- The red line of the vr_moving_average should cross below the dotted orange line of the i-AMA-Optimum indicator
- The Stochastic Wallaby indicator should be below 50
- The MACD histograms should be negative
- Enter a sell market order at the confluence of the above rules
Stop Loss
- Set the stop loss above the dotted orange line
Exit
- Trail the stop loss above the dotted orange line until hit
- Close the trade manually if the MACD histogram becomes positive
How to download and install an indicator?
In order to install the indicator on your MT4 platform, you need to follow these steps:
- Click on “Download Indicator” button located at the top right corner of the screen.
- Save the file to your computer.
- Extract and move the files into MT4>Indicator folder of the MetaTrader4 software file directory.
- Restart your Metatrader platform.
- Navigate to “Indicators.”
- And select “VR Moving Average Forex Trading Strategy” template to apply it on the chart.
Note: This indicator was developed by T. Morris. AtoZ Markets does not carry any copyrights over this trading tool.


