The Nims Forex Renko Chart Strategy is now available for download on AtoZ Markets indicator gallery.
Nims Forex Renko chart Strategy is a combination template and Metatrader 4 (MT4) indicator. This forex strategy aims to transform historical data and trading signals.
Currency Pair: any
Timeframe: any
Trading Session: any
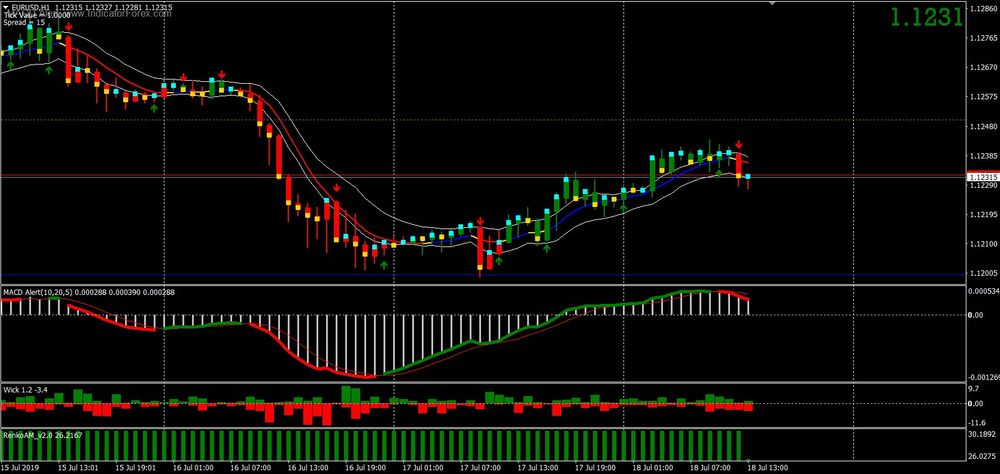
Forex Indicators:
- Tick Valu – Shows the spread and the value of a Pip.
- IINwmarrows Indicates when you should buy or sell.
- SMC4Scalper Candles – Provides information about the price movement below or above the open for a particular candle.
- 2 SMA channel HIGH – It detects breakout, trend, and range markets. It can also be used as a base for the stop loss.
- MA_In_Color_wAppliedPrice, period 10 – Identify next probable direction.
- MACD with Alert – To see if there is a crossover of 10 EMA vs 20 EMA and Convergence/divergence between them. This indicator also uses the period 5 SMA. This is basically a 100 pip difference between a 200-pip average and a 200-pip average with a 50-pip signal line on MACD in Renko Chart.
- Wick O-Gram– Identify the wicks made by the renko candles within a histogram window.
The price increased in green bars, while the price fell in red.
Place the mouse cursor on the bar to determine how many pips it takes to calculate the wick’s size. You should see the +/- pips to get the details. - Histograms Shows how many pips prices went against the trend, before moving back in the desired direction.
- RenkoAM_v2.0 This shows the time it takes to detect trade scenarios and the renko bars within a histogram. The histogram’s green bars grow every minute that the Renko candle takes. A green bar can only grow for 30 minutes, but you can adjust the settings to increase or decrease this limit. Horizontal lines are placed on for 5 minutes. If the green bars or renko candles closes lower than the red line, it’s probably a no-trade scenario and not a trade setup.
How to trade with Nims Forex Renko Chart Strategy?
Buy Entry:
- All candles should be green.
- The MA_in_applied value is blue.
- The 2 Moving Averages channel has the candles broken.
- MACD is flipped up and Signal is green
- Place the stop loss on either side of the 2 moving Averages channel.
Sell Entry:
- The candles are red.
- Red is the MA_in_applied Price
- The 2 Moving Averages channel has the candles broken.
- MACD is flipped down and Signal is red
- Place the stop loss on either side of the 2 moving Averages channel.
How to download and install an indicator?
These steps are required to install the indicator onto your MT4 platform.
- At the bottom of this post, click on the ” Download indicator” button.
- Save the file to your hard drive.
- Move the files to the MT4>Indicator directory in the MetaTrader4 software program file directory.
- Start your Metatrader platform.
- Navigate to ” Indiators.”
- To apply the template, select ” Trend dynamic Index Forex Scalping Strategy“.
NOTE: T. Morris developed this indicator. AtoZ Markets has no copyrights to this trading tool.


