You can now download the Fratelli MACD Forex Trading Strategy for free on AtoZ Markets indicators gallery.
The Moving Average Convergence and Divergence (MACD) is a staple in most trading platforms. It is a basic trading indicator that measures the difference between two moving averages and assesses the direction of the trend based on it. If the difference between the two moving averages is positive, then the trend is said to be bullish. If it is negative, then it is said to be bearish.
The most popular method of trading the MACD is by taking the trade on the cross of the midline, which is zero.
Fratelli MACD Forex Trading Strategy is a custom indicator that determines the main trend direction. It does this by printing three lines, white, blue and yellow.
The blue and yellow lines act as the main trend lines. However, unlike most trend lines, these are printed mostly as straight lines during flat market conditions and start to slope only when the market is starting to trend. The blue line is the top line and the yellow line is at the bottom. The white line act as a signal line, which hugs the price action quite closely.
Try this Fratelli MACD Forex Trading Strategy with a reputable broker on a free account:
A typical strategy based on this strategy alone would be to trade whenever the white line crosses above the blue line or the white line crosses below the yellow line.
Indicators:
- easy-forex-system
- fractals
- Fratelli_MACD
- Fisher_Yur4ik
Timeframe: preferably 15-minutes and 1-hour charts
Currency Pair: any
Trading Session: any
How to trade with Fratelli MACD Forex Trading Strategy
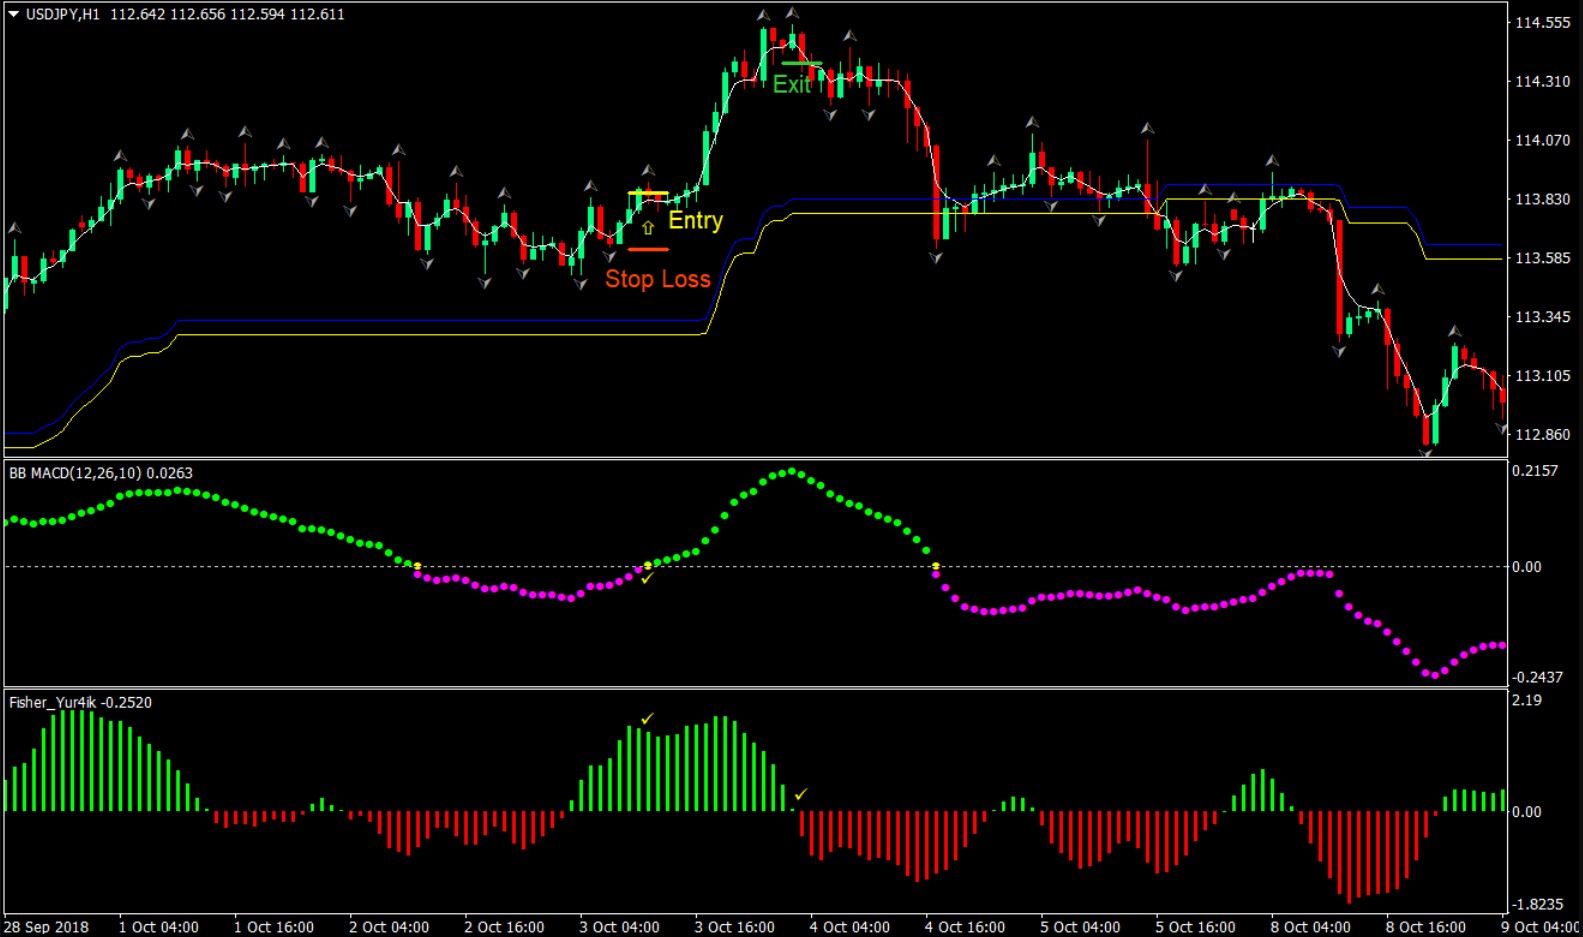
Buy (Long) Trade Setup
Entry
- Price should be above the blue line of the easy-forex-system indicator
- The Fisher_Yur4ik indicator should print lime histogram bars
- Enter a buy order as soon as the Fratelli_MACD crosses above zero and prints lime dots
Stop Loss
- Set the stop loss at the fractal below the entry candle
Exit
- Close the trade as soon as the Fisher_Yur4ik indicator prints red histogram bars
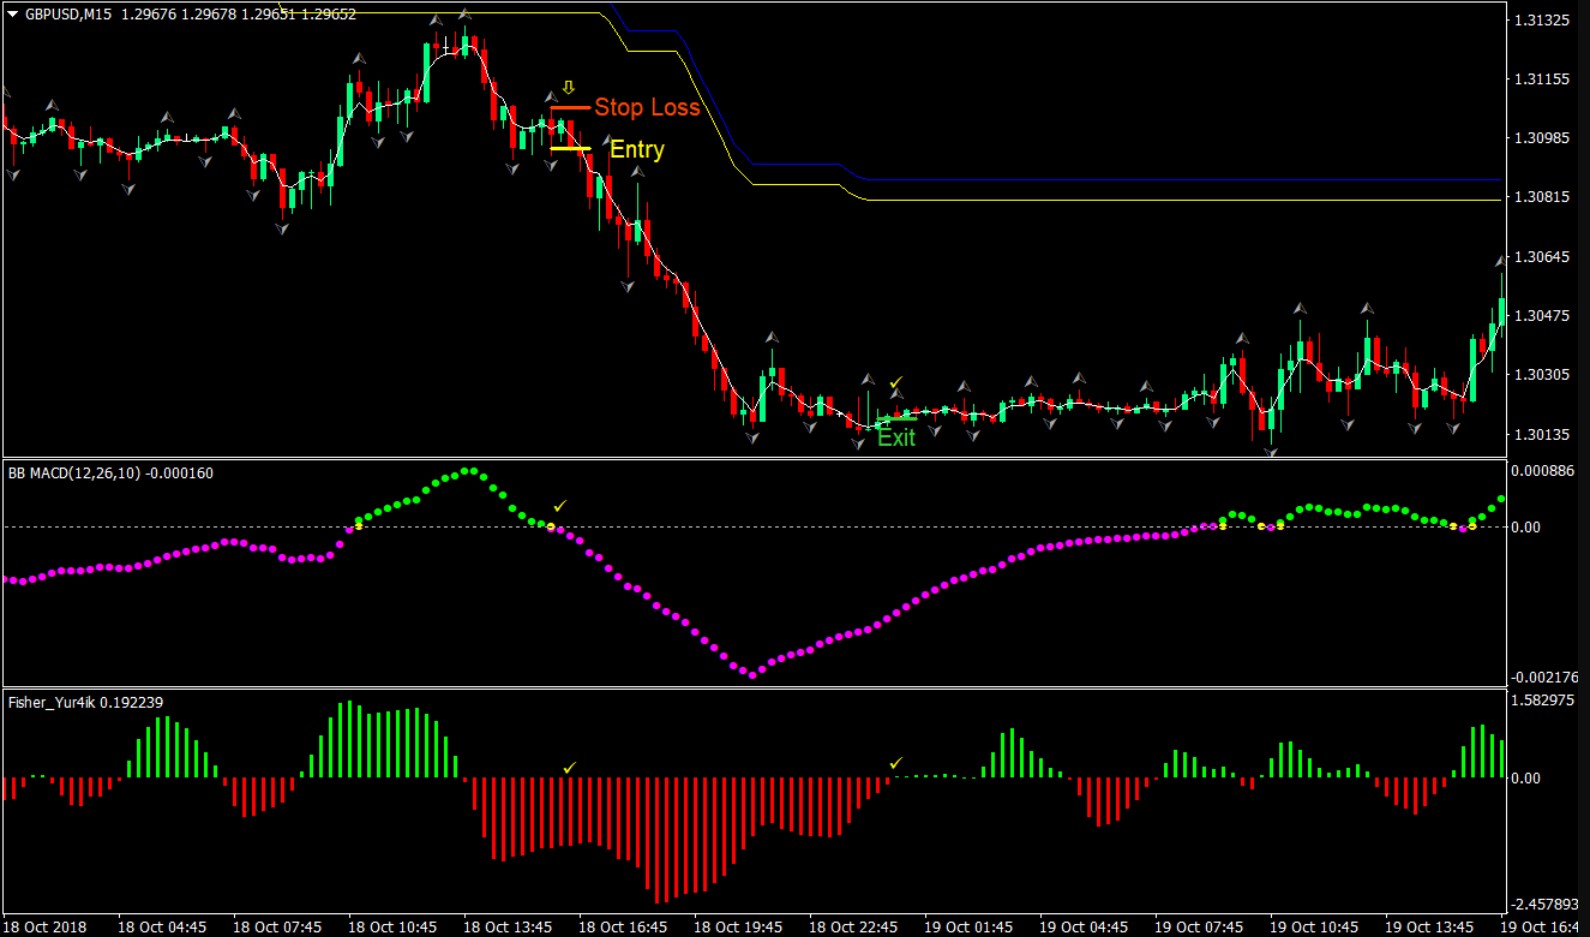
Sell (Short) Trade Setup
Entry
- Price should be below the yellow line of the easy-forex-system indicator
- The Fisher_Yur4ik indicator should print red histogram bars
- Enter a buy order as soon as the Fratelli_MACD crosses below zero and prints magenta dots
Stop Loss
- Set the stop loss at the fractal above the entry candle
Exit
- Close the trade as soon as the Fisher_Yur4ik indicator prints lime histogram bars
How to download and install an indicator?
In order to install the indicator on your MT4 platform, you need to follow these steps:
- Click on the “Download Indicator” button located at the bottom of the post.
- Save the file to your computer.
- Extract and move the files into the MT4>Indicator folder of the MetaTrader4 software file directory.
- Restart your Metatrader platform.
- Navigate to “Indicators.”
- And select the “Fratelli MACD Forex Trading Strategy” template to apply it on the chart.
Note: This indicator was developed by T. Morris. AtoZ Markets does not carry any copyrights over this trading tool.
Should you trade with this custom indicator on your own at all?
Before you start trading with the Fratelli MACD Forex Trading Strategy, you’ll want to read this.
Our in-house trading expert Dr Yury Safronau, PhD in Economic Sciences, gives you daily his best forex, stocks, metals, and cryptocurrencies to buy and sell right now.
His trading strategies which are based on non-linear dynamic models have achieved more than 65000 pips of profits since 2015. And right now there are some very strong buy and sell signals across several markets you don’t want to miss.
Want to see which ones?


