
Ralph Elliott created the Elliott Wave technique for technical analysis. This approach focuses on the fact that markets move in predictable cycles. Elliott Wave theory suggests cycles reflect market participants’ expectations of outside influences or the predominant psychology of the masses at any given moment.
The Elliot Waves Cycle
Elliott Waves theory’s main idea is that price follows a sequence of five waves depending on whether it is bullish or bearish. Three waves are directed towards the main trend while two waves are directed against it. The impulse waves, third, and fifth waves are known as corrective waves.
Five waves are formed. Three waves must be made in the opposite direction. This creates eight waves. This cycle is known as Elliot Waves Cycle.
Waves form when cycles are divided into waves over longer time frames. Eight Elliot Waves Cycles that were formed on a larger timeframe are now creating one Elliot Wave Cycle. You can also divide large patterns into smaller degrees. All waves can be seen as two pieces of the same larger pattern, but contain smaller waves. Fractalization is a peculiarity of Elliot Waves. Let’s now discuss what fractals actually are.
Description of the 5 Elliott Waves
Fractals can be described as formations that can easily be broken down into smaller parts. Each part looks exactly like the whole. Below is a detailed description of the Elliot waveforms.
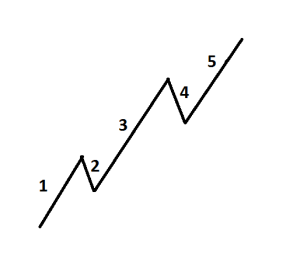
Wave 1 – When the “market psychology”, is almost entirely bearish. The news is bad. It is usually very strong. Market sentiment is changing rapidly (changing the bearish tendency to bullish and breaking through a powerful resistance level etc. ).
Wave 2 – When the market has reacted to recent prices in a dramatic way. Wave 2 can reverse 100% of Wave 1’s size, but it cannot roll back lower than Wave 1. It is usually around 60% of Wave 1. This is because it follows the main trend of investors who are making profits.
Wave 3 – Investors are experiencing a sharp rise in optimism. This wave is almost always the biggest with very few corrections. It will never be the fastest. As volumes rise, prices increase. Wave 3 is typically higher than Wave 1 by at least 1.618 or more.
Wave 4 – It is sometimes difficult to identify. It usually rolls back by 38% of Wave 3.
Wave 5 – This wave can be identified by divergence. When average trading volumes dominate the market, rising prices are likely. The wave ends with a sharp rise in trading volumes.
Three Rules of Elliot Waves Theory
Three rules can be used to help traders apply theory to a chart.
Rule 1: Wave 2 must not fall below the entry level for wave 1.
Rule 2: Wave 3 must not be smaller than wave 1 and wave 5
Rule 3: Wave 4 cannot intersect with wave 1.
The risk involved with forex trading online shouldn’t be overlooked. There is a chance of losing a significant amount of money if you don’t know what you’re doing. It is crucial to gain a knowledge of the market prior to you even begin investing with money. Keep reading our lessons.