Forex price action trading is all about analyzing who currently controls price, whether bulls or bears and if they are likely to stay in control.
As we mentioned before, forex price action trading is all about analyzing who currently controls price, whether bulls or bears and if they are likely to stay in control. This is done by looking at things like support and resistance levels, trend lines, chart patterns, and candlestick formations.
One of the benefits of price action trading is that it doesn’t require the use of lagging indicators, which can often give conflicting signals. This means that you can have a much simpler and more effective trading strategy.
Here are some key things to remember:
-The first step is to identify the current market conditions. Is there a clear trend or is the market range-bound?
-Once you’ve identified the market conditions, you can then look for specific price action setups that have a high probability of leading to a profitable trade.
-It’s important to remember that no single price action setup is 100% accurate, so you need to use proper risk management when trading.
-Finally, don’t forget to have patience! Not every trade setup will pan out and you need to be patient in order to find the best opportunities.
Price action Tools
Price action trading is not about using a bunch of fancy indicators. In fact, many successful price action traders use very few indicators. Instead, they focus on things like support and resistance levels, trend lines, chart patterns, and candlestick formations.
Here are a few of the most popular price action trading tools:
-Support and resistance levels: These are areas where the price has historically found some level of support or resistance.
-Trend lines: Trend lines are used to identify the current trend. They can also be used to spot potential reversals.
-Chart patterns: There are many different chart patterns that can be used in price action trading. Some of the most popular ones include head and shoulders, wedges, and triangles.
-Candlestick formations: Candlesticks can provide a lot of useful information about market sentiment and potential reversals. Some of the most popular candlestick patterns include the doji, hammer, and shooting star.
Basic Patterns of the Price Action trading strategy
Pin Bar
A pin bar is a type of candlestick formation that can be used to signal a potential reversal in the market. It is characterized by a long tail and a small body, with the tail pointing in the opposite direction of the current trend.
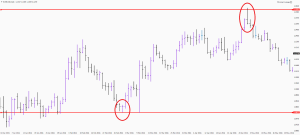
The pin bar can be used in any time frame, but it is most often used in the daily or weekly time frames. When trading pin bars, you should look for a few things:
-First, you want to make sure that the tail is at least twice as long as the body. This shows that there is significant selling pressure in the market.
-Second, you want to make sure that the tail is pointing in the opposite direction of the current trend. This shows that there is a potential change in market sentiment.
-Finally, you want to make sure that the pin bar is forming at a key level of support or resistance. This increases the chances that the market will reverse at this level.
The pin bar is a very powerful price action tool and can be used in a number of different ways. Here are a few ideas:
-You can use the pin bar to enter a trade in the opposite direction of the tail. For example, if you see a bearish pin bar forming at a key level of resistance, you could sell the market.
-You can use the pin bar to exit a trade that is going against you. For example, if you are in a losing trade and see a pin bar forming, you could use it to exit the trade.
-You can use the pin bar to take profit on a trade that is going in your favor. For example, if you are in a winning trade and see a pin bar forming, you could use it to take profit.
The most important thing to remember about trading pin bars is that they are not 100% accurate. This means that you need to use proper risk management when trading them.
Outside Bar
The next important Price Action pattern is called Outside Bar or Takeover. The Outside Bar pattern appears when the price movement range of a particular candle is greater than the movement range of the previous candle. There are two types for this pattern: bullish takeover and bearish takeover.
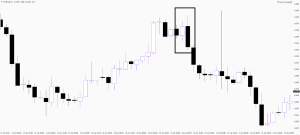
The price movement needs to have an opposite direction and a larger range. This means that the probability of a trend change is high. However, in order to start acting you should look at the next candle and if it confirms a trend change, then you can open trades.
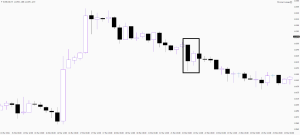
Inside Bar
The inside bar is a combination of two candles. The Inside Bar pattern appears when the price range of the second candle is within the price range of the first candle. The inside bar is not a reversal pattern. And it is also not a continuation model. The price can go both up and down. It should be considered as an attention signal.
The risk involved with forex trading online shouldn’t be overlooked. There is a chance of losing a significant amount of money if you don’t know what you’re doing. It is crucial to gain a knowledge of the market prior to you even begin investing with money. Keep reading our lessons.