Forex oscillators are technical indicators that are used by traders to help identify market trends and potential trading opportunities. There are many different types of forex oscillators, but the most popular ones are the Relative Strength Index (RSI), the Stochastic Oscillator, and the MACD. Each of these indicators has its own unique way of measuring market momentum, and each can be used in different ways to help traders make better decisions.
RSI
The RSI is probably the most popular forex oscillator, and it measures the relative strength of a currency pair over a certain period of time. The RSI is calculated using a formula that takes into account the closing prices of a currency pair over a certain number of days. The resulting number is then plotted on a scale of 0 to 100, with values below 30 indicating oversold conditions and values above 70 indicating overbought conditions.
Stochastic
The Stochastic Oscillator is another popular forex oscillator, and it works in a similar way to the RSI. The main difference is that the Stochastic Oscillator uses a different formula to calculate its values. This indicator is also plotted on a scale of 0 to 100, with oversold conditions being indicated by values below 20 and overbought conditions being indicated by values above 80.
MACD
The MACD is a bit more complex than the other two forex oscillators, but it can be a very useful tool for traders nonetheless. The MACD is calculated by subtracting the 26-day exponential moving average (EMA) from the 12-day EMA. The resulting number is then plotted on a histogram, with positive values indicating bullish momentum and negative values indicating bearish momentum.
Each of these forex oscillators can be used in different ways to help traders make better decisions. For instance, the RSI can be used to identify overbought and oversold conditions, while the MACD can be used to identify changing market trends. However, it’s important to remember that no indicator is perfect, and that all indicators should be used in conjunction with other technical indicators and fundamental analysis.
How to use RSI, Stochastic and MACD together?
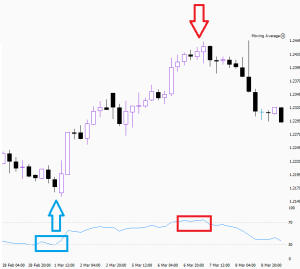
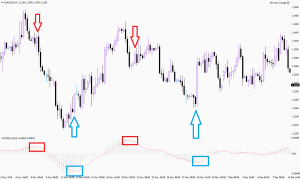
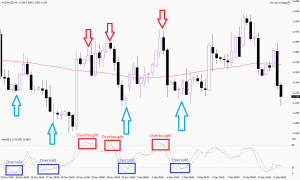
The most common way to use these indicators is to look for overbought and oversold conditions. For instance, if the RSI is above 70, it may be time to sell, and if the Stochastic Oscillator is below 20, it may be time to buy. However, it’s important to remember that these are just general guidelines, and that it’s always best to wait for confirmation from other indicators before making any trading decisions.
Another way to use these indicators is to look for divergences. A bullish divergence occurs when the indicator is making higher highs even though the price is not. This may be an indication that the price is about to start moving higher. A bearish divergence occurs when the indicator is making lower lows even though the price is not. This may be an indication that the price is about to start moving lower.
Finally, these indicators can also be used to confirm trends. For instance, if the MACD is above zero and rising, this may be an indication that the trend is bullish. If the MACD is below zero and falling, this may be an indication that the trend is bearish.
While these are just a few of the ways that forex oscillators can be used, they should give you a good idea of how these indicators can be helpful in your trading. Just remember that no indicator is perfect, and that it’s always best to use multiple indicators in conjunction with each other to get the most accurate picture of what’s happening in the market.
The risk involved with forex trading online shouldn’t be overlooked. There is a chance of losing a significant amount of money if you don’t know what you’re doing. It is crucial to gain a knowledge of the market prior to you even begin investing with money. Keep reading our lessons.