
The application of Pivot points is a common method for determining the level of support and resistance. In this lesson, you’re going to be taught how to utilize it properly.
The primary ranges of resistance and support are just one of the primary factors traders employ to create their trading strategies. If a trader feels that the zone of resistance or support is sufficiently strong, they usually place stop or limit orders on it. Also, it is a zone of interest.
It is vital to remember that, like all other things in technological analysis, Pivot Points are governed by a specific level of probability. They are calculated with different formulas , and consequently built at different locations. But, the majority of times, these levels are calculated using an old formula.
How to use Pivot Points? It is possible to use Pivot Points exactly the same way as levels of resistance and support.
How Pivot Points Are Calculated?
The most efficient method of calculating your Pivot is to employ the following formula that has been utilized in Wall Street for decades: You will take the highest price, the minimum price and close price of a specific time period, and then the total is divided by three (Pivot=(High + Low + Close) 3).
The pivot point is utilized to determine three levels of resistance and support This can be accomplished by applying the following formula:
R1 = Pivot + (Pivot – Low)
R2 = Pivot + (High – Low)
R3 = High + 2*(Pivot – Low)
S1 = Pivot – (High – Pivot)
S2 = Pivot – (High – Low)
S3 = Low – 2*(High – Pivot)
R1, R2, and R3 are the three zones of resistance.
S1, S2, S3 are three support zones.
These are the areas in which careful attention must be paid. For example, If the price jumped to S1 If there is no reversal in the price, you must wait for a response at S2. If the price continues to move it is best to wait for S3.
What should you do with Pivot Points?
It is recommended that you make use of Pivot Points to:
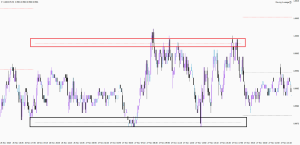
Zones of resistance and support;
Zones that break down and pullbacks.
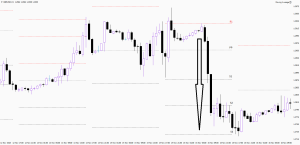
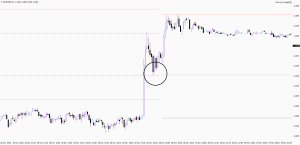
Pivot lines are often channelized. In the event of a false breakdown an intense movement in the opposite direction could be observed. This is an outcome of the psychology of trading. Fake break (the entry point to the new trend that did not occur) is a failure, following which the opposite side starts to move. After the actual break, the best choice is not to go in immediately, but rather hold off until the rollback reaches support, which typically becomes the resistance.
Tip: Opening up a position after a true breakdown is among the most effective strategies.
Pivot points are basically levels of resistance and support that are created automatically based on the formulas. The way that traders use the same method as for support and resistance. On one hand, the automatically calculated pivot points eliminate the need to draw manually levels of resistance and support. However the formula is still an equation, and thus pivots are not replacements, but rather enhance the support/resistance levels that can be drawn by hand (manually).
The risk involved with forex trading online shouldn’t be overlooked. There is a chance of losing a significant amount of money if you don’t know what you’re doing. It is crucial to gain a knowledge of the market prior to you even begin investing with money. Keep reading our lessons.