Divergence is a popular tool for technical analysis. Many traders use divergence because it generates reliable entry signals. It can sometimes be difficult to spot divergence on a chart. This is why it is important to learn how to identify and apply it.
Divergence overall refers to a situation where there is a discrepancy in the price chart and technical indicator charts. To put it another way, traders need to compare two charts (indicator charts and price charts) and determine if they move in opposite directions.
Divergence is a warning sign for traders to be cautious. This signal can be taken as either a trend reversal, or as its continuation depending on the situation. Sometimes, divergence can develop multiple lows or highs prior to actual reversal. It is important that you get a confirmation signal before taking any action. Trend reversal confirmation is usually achieved by traders looking for a higher high or lower low, surpassing maximum or minimum of previous bars, breaking through important support/resistance levels, etc.
Types of Forex Divergence
There are four types of divergence:
- Regular bullish;
- Regular bearish;
- Hidden bullish;
- Hidden bearish.
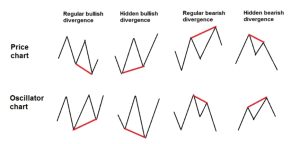
Regular divergence model is commonly used by Forex traders as a triple/double top. In an uptrend, for example, three to four higher price charts can correspond with three to four lower oscillator charts. In contrast, a downtrend with three to four lower lows in the price chart will have three to four higher oscillator charts. This is known as a triple- or quadruple frequent divergence. This indicates weakness in the current trend and potential reversal. You should keep your entries as normal if you notice a divergence.
Hidden divergence can be used to develop trend determination and analysis. Hidden divergence can help you determine the right time to enter the market in a particular direction. If there is a hidden divergence then the price will move to the minimum or maximum that a trader can use for an entry point. If the distance between the entry point and the minimum/maximum is not very large, it’s best to wait. Pay attention to the third and fourth highs and lowest points when a hidden divergence forms. It is best to wait until you see the correct divergence formation at either the third high (for an uptrend) or the lowest (for a downtrend). Similar signals indicate a possible trend reversal.
Hidden divergence can be difficult to spot and easier to interpret than regular. Most traders don’t use it. A combination of hidden and regular divergences can give you more precise signals and help improve your trading performance.
The Use of Forex Divergence
Flat markets can also create forex divergence. This time period is used to test previous flat range minimums and maximums.
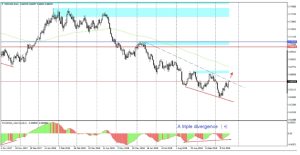
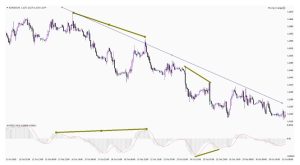
Below chart shows how the trend line can be used to identify divergence. A trend line can be drawn and extended along the length of the chart when there are two minimums. If price is close to the trend line, you should pay attention to the oscillator as a hidden divergence may form. It is obvious that there is a hidden divergence (olive-line).
Pay attention to the situation when the price is close to the trendline (Oct 23rd). The regular Forex divergence (second olive line in MACD) appeared at that point. This signal means that the hidden divergence can no longer be used in this situation and that there is a chance of a trend reversal.
The risk involved with forex trading online shouldn’t be overlooked. There is a chance of losing a significant amount of money if you don’t know what you’re doing. It is crucial to gain a knowledge of the market prior to you even begin investing with money. Keep reading our lessons.