
Litecoin has lost further in 2018 in a bearish Cryptocurrency corrective stage. Where should we expect a price reversal at the end of the correction? The following is the February 2018 Litecoin price technical prediction using Elliott wave theory.
27 January, AtoZForex - In the first half of December 2017, Litecoin soared to an all time high. Price looked as if it would break above $500 after trading above $420. It opened below $100 in December and gained more than 360% to cap a massive 2017. In the last two weeks of the year 2017, however, it took a big hit below $150 before a quick recovery to $250. Since the turn of this year, LTC has been trading between $250 and $130.
Looking at the price chart of LTC, the bearish move is probably not yet over. Though there may be a bullish recovery soon but price could still drop below $100. The market is in a corrective stage - a deep one, typical of wave 2. Will this bullish recovery happen in February.
In the last update, we had this scenario.
LTC/USD price chart (Elliott wave analysis), H3 (click to zoom)
The chart above shows the correction downside could have one more leg left to complete what could be a double zigzag pattern. If this happens, LTC could be seen around $80 to complete the second wave. Unless a strong break above the channel happens in the coming days, price could drop below $100 to $80 and possibly $40.
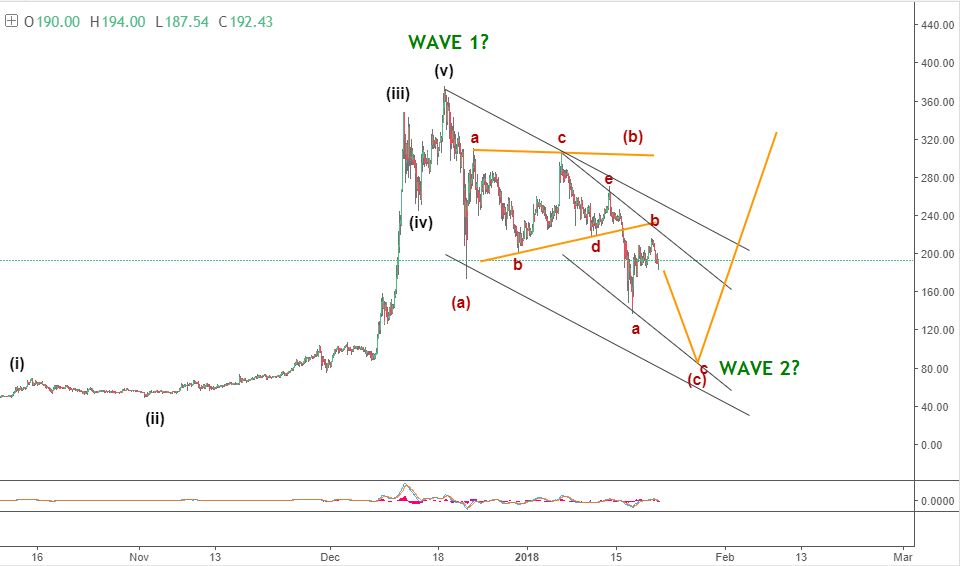
If the wave count above is correct, a dip could be seen at the early days of February before a bullish recovery above $200. Price could move in many other ways but this is a scenario of high probability. The chart below shows an alternative scenario that shows wave 2 could take longer time and deeper than expected.


February 2018 Litecoin price technical prediction- alternative view
 LTCUSD Elliott wave analysis, H2 (click to zoom)
What should we expect in February?
The chart above shows the possibility of a diagonal pattern - this could be a leading diagonal completing wave A of 2. This pattern could complete at $125. If price stays above $125, a rally could happen to $300 in February. This could lead to about 150% rally before the next dip.
Do you have other views in contrast to the ones listed or you want to compliment them further? let’s know by your comment below.
Don’t forget to share this analysis with people that matter to you.