
AtoZMarkets - The leading diagonal according to the wave theory starts an impulse wave or an a-b-c correction. It is most commonly seen in wave 1 of an impulse wave. It's a 5-3-5-3-5 pattern unlike the ending diagonal that sub-divides into 3,3,3,3,3 structure. The USDCAD as seen below was on a long corrective move from April 2016 and seemed to have ended last year. The corrective pattern was preceded by a fast impulse bullish move in the first 4 months of 2016. The bearish trend was hugely caused by Oil price rally that greeted the early part of 2016.
 Daily USDCAD Elliott wave analysis (click to zoom)
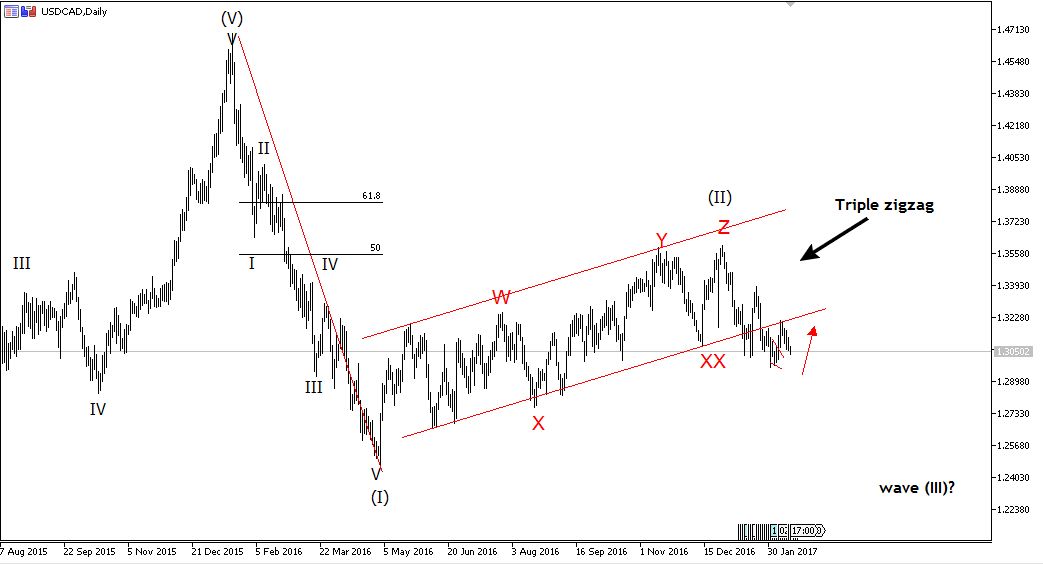
The bullish rally completed a triple zigzag pattern and then a breakout of the channel. With the zigzag completion, a wave 2 is complete. Price will continue the dip which can permeate the first half of 2017 as wave 3 begins to surface. Wave 3 must be an impulse wave. Our searchlight will now be on the move that appears to follow the triple zigzag top. Based on 14 February USDCAD Elliott wave forecast, we identify the first wave of the impulsive wave 3 to be a leading diagonal. The chart below shows the pattern is the later stages.
Want to trade using Elliot wave with a regulated broker? Open a free account with AtoZ Markets approved forex brokers:
14 February USDCAD Elliott wave forecast: leading diagonal?
The chart below shows the emergence of a leading diagonal pattern on the H4 chart.
 Hourly USDCAD Elliott wave analysis (click to zoom)
The chart above shows a leading diagonal that sub-divides into a 5,3,5,3,5 structure. The (i)-(iii) and (ii)-(iv) trendline projections are also converging. This is a 'textbook' and classic leading diagonal Elliott wave pattern. What's the implication of this?. The pattern will complete at 1.29 or above. The recent bearish move will continue to 1.290-1.295 before the pattern can be said to be complete. By definition, a dip to 1.28xx is within the confine of the leading diagonal but pattern will be overstretched. If price shows a good bullish sign at 1.29-1.295, there can be a good bullish breakout. At this point a reversal upside will happen before the bearish move continues. Intraday traders can take advantage of the bullish correction. Swing traders can wait for the correction and join the bearish party that could follow.
Should you trade using Elliot wave on your own at all?
Before you start trading with Elliot wave, you'll want to read this.
Our in-house trading expert Dr Yury Safronau, PhD in Economic Sciences, gives you daily his best forex, metals, and cryptocurrencies to buy and sell signals right now.


His trading strategies which are based on non-linear dynamic models have achieved more than 65 000 pips of profits since 2015. And right now there are some very strong buy and sell signals across several markets you don't want to miss.
Want to see which ones?