The Relative Strength Index (RSI) is one of the more popular indicators among traders, and it is definitely worth its fame. Let’s take a look into how the RSI works and more importantly how we could use it to improve our trading results.
The RSI Divergence Forex Trading Strategy is about the confluence of divergence trading and the overbought or oversold market conditions. This will further be improved by observing for price patterns or candlestick patterns that indicate a probable reversal.
To aid us in our quest for pips, we will be using the ZigZag indicator. This is not the main indicator for this strategy but is more of a training wheel to help traders identify swing highs and lows. These swing highs and lows should usually coincide with the peaks and troughs on the RSI window.
We will then wait for the RSI to move to an overextended market condition, either overbought or oversold. Once this happens, we then observe for divergences or if a divergence would develop at the next peak or trough.
These divergences should also coincide with a reversal candlestick pattern (pin bar, engulfing patterns, etc.) or better yet also with a price pattern (double tops, head, and shoulders, etc.). We then trade these setups as soon as it develops.
Indicator
- ZigZag Indicator: Depth = 5
- RSI: Period = 10
Currency Pair: any
Timeframe: any
Trading Session: any
How to trade with RSI Divergence Forex Trading Strategy?
Buy (Long) Trade Setup Rules
Entry
- A trough on the RSI should have visited the oversold area below 30
- A bullish divergence should be observable
- A bullish candlestick pattern or price pattern should be observable
- Enter a buy market order at the close of the candle which forms the pattern


Stop Loss
- Set the stop loss at the swing low below the entry candle
Take Profit
- Option 1: Set the take profit at 2x the risk
- Option 2: Set the target take profit at a recent swing high
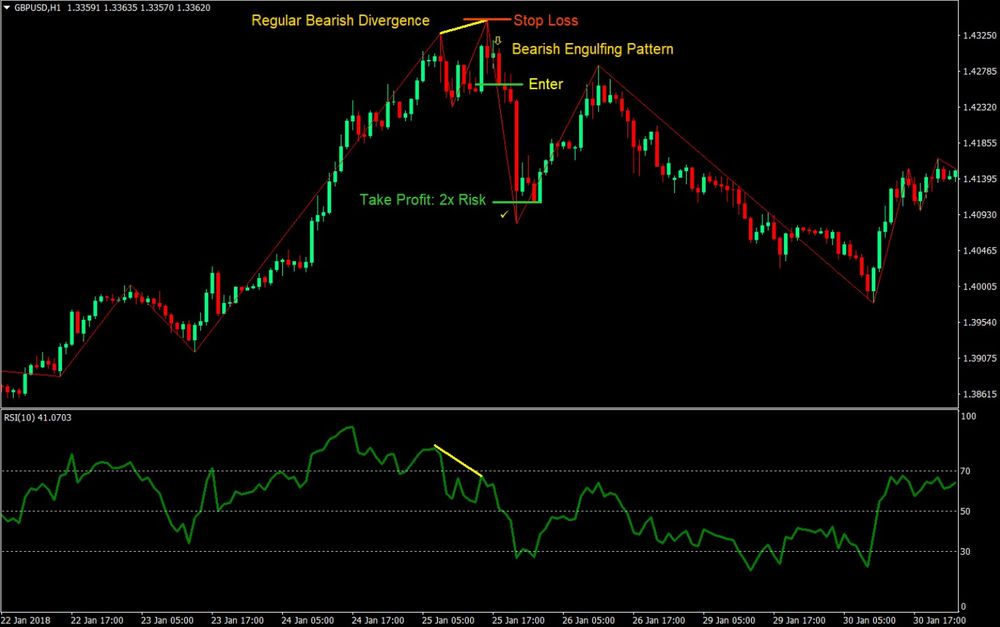
Sell (Short) Trade Setup Rules
Entry
- A peak on the RSI should have visited the overbought area above 70
- A bearish divergence should be observable
- A bearish candlestick pattern or price pattern should be observable
- Enter a sell market order at the close of the candle which forms the pattern
Stop Loss
- Set the stop loss at the swing high above the entry candle
Take Profit
- Option 1: Set the take profit at 2x the risk
- Option 2: Set the target take profit at a recent swing low
How to download and install an indicator?
In order to install the indicator on your MT4 platform, you need to follow these steps:
- Click on “Download Indicator” button located at the bottom of the post.
- Save the file to your computer.
- Extract and move the files into MT4>Indicator folder of the MetaTrader4 software file directory.
- Restart your Metatrader platform.
- Navigate to “Indicators.”
- And select “RSI Divergence Forex Trading Strategy” template to apply it on the chart.
Note: This indicator was developed by T. Morris. AtoZ Markets does not carry any copyrights over this trading tool.