
In the last Elliott wave analysis update on USDCAD, we wrote about a rally to 1.358 after a brief dip. And the price acted almost as expected. More important is the probable return of the long term bearish trend to 1.3 and the final breakout below it. Will an expected bullish drive in Crude oil take the price of USDCAD low? Let's look into our USDCAD Elliott wave analysis.
21 November, AtoZForex - USDCAD has a very strong inverse correlation with Crude oil. This means they move in opposite direction at a very close relativity. After Poloz's statement in September that " it will take 3 to 5 years for CAD economy to recover from lower oil prices" which translate to "the price of USDCAD will continue to rise in 3 to 5 years", one would have expected the long term rally to continue. But with Oil prices rallying, prices is expected to continue the bearish run after a long but shallow correction upside.
In our USDCAD Elliott wave analysis before the US elections we quoted as thus:
Technically, price is expected to dip to 1.317-1.322 this week (especially if there is a breakout as shown in the chart below), before a rally to 1.358 probably follows as price’s intra-day deflection is expected to be hugely affected by the election activities in the U.S.
Will USDCAD resume the bearish move?
 H6 USDCAD Elliott wave analysis chart (click to zoom)
The chart above shows the terminating part of the long term double Zigzag correction from 1.245. The patterns seems to have reached a very strong Fibonacci cluster region at 1.358.
What makes 1.358 a crucial price level?
What makes 1.358 crucial?


- 50% Fibonacci retracement of long term Wave A at 1.358
- 100% projection of wave (w) from wave (x) at 1.3580
- 100% projection of wave (a) of (y) from wave (b) of (y) is 1.3555
- 61.8 % projection of wave a from b - both subwave of wave (c) of y) of B at 1.3583
- Channel ceiling.
This makes a price range of 1.3555 to 1.3583 which form a very strong resistance. Such price levels are crucial and often result to major corrections or reversals.
USDCAD double-top formation
Price is returning from 1.3589 with a double top chart pattern as shown below.
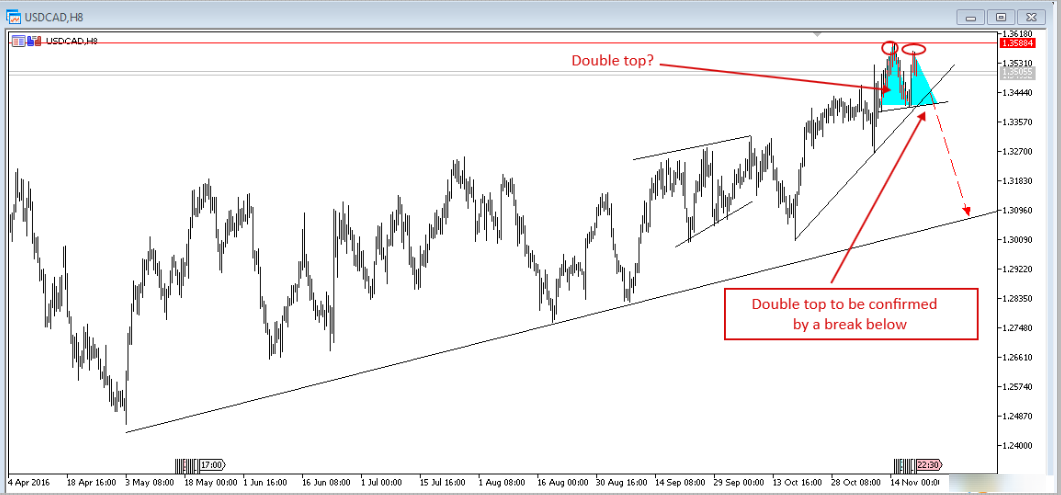 H8 USDCAD Elliott wave analysis chart (click to zoom)
With the double top ( a reversal pattern) shown above, there is a strong case for a bearish move. Two reversal price patterns terminating at a crucial price level can't be overlooked. This is the sort of occurrence that precede a wild movement.
We believe that if price can break below 1.3371, a bearish move to the regions of 1.30 is very likely. With more momentum downside , a breakout of the channel will happen in a move that will confirm the bearish move resumption.
We believe a good rally in the prices of Crude oil will add to this.
We will update you on AtoZforex.com as price moves in the coming days.
Do you have other views in contrast to the ones listed or you want to compliment them further? let’s know by your comment below.
Don’t forget to share this Elliott wave intraday analysis with people that matter to you.