
USDCAD is technically at a 'cross-road' where a major event is expected to drive price either way. Bullish above 1.385 or bearish below 1.30. Will USDCAD long term bullish correction continue or the bearish trend has finally resumed? This we answer below based on our USDCAD Elliott wave analysis.
09 January, AtoZForex - When OPEC agreed to cut Oil output in November 2016, prices were buoyant for CAD. USDCAD dropped very fast to 1.32 en-route 1.3. It was thought the long-awaited bearish trend has resumed. Few weeks after the good news from the Oil producing countries, the interest rate was hiked in the US and USDCAD rallied just before breaking below the long term corrective double zigzag channel. The rally was resisted by a long-watched strong technical resistance at 1.358 and a fast dip followed. The recent dip now hit an important support level at the neighborhood of 1.32.
If price rallies from the present level to break above 1.358, the long term correction will continue and transform from a double zigzag to a triple zigzag corrective pattern targeting 1.383 price level. On the other hand, price may break below the channel to make sure the double zigzag pattern still holds. Price could also continue ranging between 1.32 and 1.358. Let's look at how price could react in the coming weeks to come
USDCAD Elliott wave analysis: Will there be more bullish move?
Our preferred view is shown in the chart below. USD is strong against major currencies. The USDCAD is expected to continue the long term corrective rally.
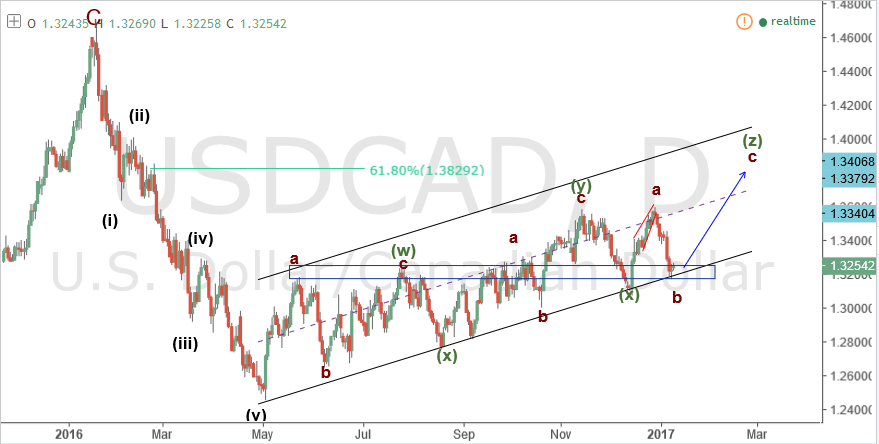 Daily USDCAD Elliott wave analysis chart (click to zoom)
The above chart indicates the possibility of the continuation of the bullish correction t0 1.383 (an important Fibonacci level) to complete a triple zigzag pattern. Only a break below the previous low at 1.3075 will violate this view. It should be noted that the correction may have ended at 1.358-1.359 (level at which the double zigzag is completed).


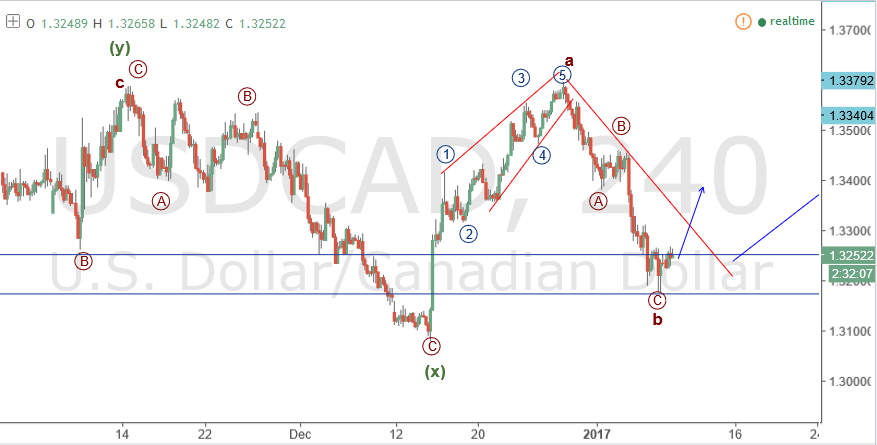 Hourly USDCAD Elliott wave analysis chart (click to zoom)
The chart below shows the completion of the sub-wave b of the last leg of the prospective triple zigzag. The minimum requirement to consider a bullish trade opportunity is if price breaks above the trend line upside with good bullish candles while still being maintained above 1.32. The breakout rally is targeted to continue to 1.38 price level.
Alternatively, if price breaks below 1.32 below the trendline, the double zigzag will be preferred. The implication of this is this: the long term correction has completed and price will go down further. In this case, it will be important to wait for the recent bearish move to continue and wait for correction. We will be here at AtoZforex to update you.
Do you agree with this analysis or you have a different view?. Would you like sharing your view with us?. Please comment your view below. Don't forget to share this analysis on your social media pages.