
October 09, 2019 | AtoZ Markets - Aside from the FOMC policy meeting, the economic calendar is a bit light today. The attention on today's Fed statements has been overshadowed by the US-China trade talks expected to start tomorrow in Washington. The S&P 500 has continued to fall in October after a sharp recovery last week. The stock index fell by 72 points between late New York session on Monday and early in the Asian session on Wednesday when some sort of pessimism concerning the trade talks rocked the market. The Nasdaq and Dow Jones also plummeted in the same period.
However, two headlines have lifted the mood of the market today. The Financial Times reported that China has offered to buy $10 billion more of US agricultural good to make way for smooth trade talks. There were also reports that China will be open to a partial deal. As a result, the S&P 500 (SPX) gained about 37 points. Related market headlines may rock the market during the Asian session as well. Despite these, the market looks cautious and sentiments will be moderate until after the meeting.
SPX Elliott wave analysis: long-term outlook
Overall, the SP 500 still looks bullish although an attempt in late September to break above the 3000 handles was not successful and the price has been dropping since. Currently, SPX is attempting a break below the neckline of a wedge/diagonal pattern formed between December 2018 and September 2019. The chart below also shows that the diagonal pattern could be the end of the first sub-wave of the 5th wave of the long term trend.
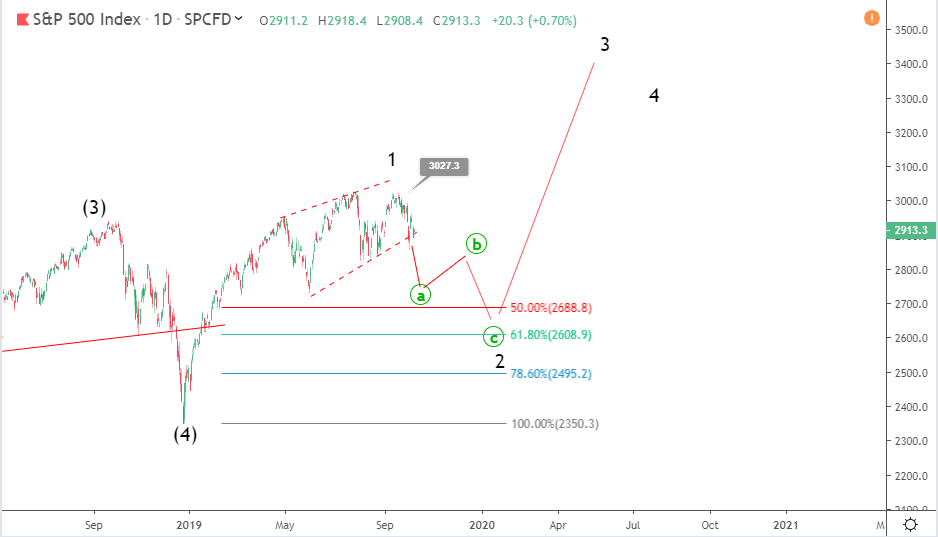
If the diagonal neckline (support trendline) is breached, the US stock market is expected to continue the minor decline. SPX could hit 2700 or 1600 which are the nearest support levels. It might decline deeper. However, the long term bullish trend is still intact. If it resumes, the next surge should take the index toward 4000 to make a new record high. The near-term direction is expected to be influenced by the important trade talk on Thursday.