
The S&P 500 has completed two phases of advancement, and it seems price is in the last phase. Where and when could the last phase get phased out before the bearish correction? We measured the advancement based on our S&P 500 Elliott wave analysis.
30 November, AtoZForex - The S&P 500 is the index of the 500 leading stocks in the United States. It is one of the most popular benchmarks used to gauge the the U.S equities. There is a positive correlation between the leading stock index of a country and its currency. The S&P 500 amassed a 300% rally from 2009 to 2015 in a very buoyant period for the United States equity markets. Since 2009, price has been increasing with a very fast impulse wave.
As the US dollar soars, the S&P tend to do the same. It is therefore good to note that the activity of one can be used to forecast the other. Based on the weekly S&P 500 Elliott wave analysis shown by the chart below, price has been advancing in an impulse wave from 2009. According to the Elliott wave theory, after the completion of such a move, a correction in the opposite direction is expected. When and where will the correction likely occur?
 S&P 500 Elliott wave analysis - W1 Chart
The weekly chart above shows that price is presently in the third wave of an impulse bullish rally. Impulse waves are 5 non-overlapping waves in the direction of the prevailing trend. In between these rallies are short corrections each. Price is in the last leg of the bullish trend. In the coming months, we may see S&P 5oo exhausting the bullish drive.
S&P 500 Elliott wave analysis: where will the 5th wave terminate?
The progressing 5th wave is expected to reach 2279-2363. 2279 is the 61.8% Fibonacci projection of wave 1 from wave 4. While 2363 is the 38.2% Fibonacci projection of wave 1-3 from 4. Wave 5 is expected to be the shortest among the actionary waves or at most be of equal size with wave 1. A move to 2549 is also possible- 2549 is the 100% projection of wave 1 from wave 4. A terminating pattern is thus expected to complete at these regions to trigger the bearish correction.


S&P 500 Elliott wave analysis: What terminating pattern is price forming at the 5th wave?
There are two scenarios here.
First scenario: rally to 2279-2363?
If price rallies to 2279-2363, there is a likelihood that the terminating 5th wave shown below will emerge.
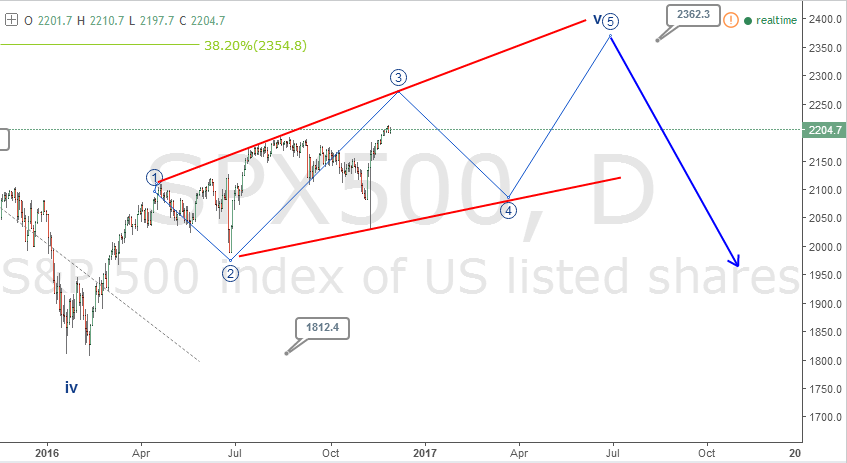
The chart above above shows an expanding diagonal terminating pattern. This pattern doesn't occur often but it does occur. With this pattern, it will be expected that price dips sharply before the final rally to 2362. This may not be the exact way price will play out, but it's a strong possibility.
Second scenario: rally to 2549?
This scenario supports a further rally above 2363 to 2459. This means that the 5th wave is expected to be an impulse wave. The chart below demonstrates this scenario.

Lastly, the chart above shows the Elliott wave forecast of the 3rd sub-wave of wave 5 as S&P 500 continues to rally. By projection, this will take price to 2549. The US equities have enjoyed long period of profits as shown by the S&P 500 index. Price may move in many other ways. We just presented few of them with continued bullish expectation.
Think we missed something? Let us know in the comments section below.