There is a clear inverse correlation between Gold and DXY index. Gold prices are on the rise while DXY index is weakening. Will the recovery last long?
29 June, ADS Securities – Following two consecutive bearish sessions, the precious metal rebounded in the prior session to finish at $1249.10, after making a high at $1255.70, supported by a weaker US Dollar.
Inverse correlation between Gold and DXY index
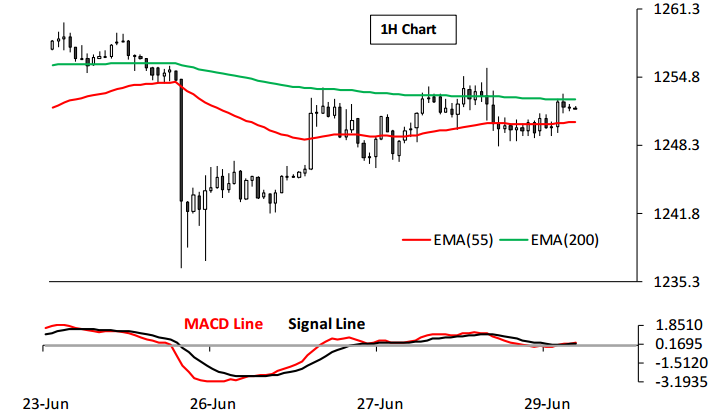
As visible on the 1H chart, the Gold is trading with a positive showing, reflecting at the presence of bullish momentum in the coming session. In addition, the MACD indicator has witnessed a signal line crossover from below, further affirming the above stance.
The key technical barrier is positioned at the $1254 level, followed by the $1257 and $1260 levels. A sustained break above the latter might trigger a further acceleration to the upside. On the losing side, key near-term support is positioned at the $1250 level, where EMA 55 is trading, a move back below which might lead to bearish pressure in the yellow metal, paving way for the $1248 and $1245 levels.

ADS Securities Risk Disclaimer
Trading foreign exchange, foreign exchange options, foreign exchange forwards, contracts for difference, bullion and other over-the-counter products carries a high level of risk. Hence, it may not be suitable for all investors.


All opinions, news, analysis, prices or other information contained in this communication are provided as general market commentary. It does not constitute investment advice. Nor a solicitation or recommendation for you to buy or sell any over-the-counter product or another financial instrument.