
AtoZ Markets – Harmonic pattern was discovered by HM Gartley. Later on, it was improved and developed by Larry Pesavento, who wrote a book about harmonic trading and Fibonacci ratios.
Harmonic patterns are similar to the traditional chart pattern like Head and Shoulder. However, the specialty of the harmonic pattern is that it considers Fibonacci ratios and price momentum, which is a critical price action element. The Fibonacci ratios include both Fibonacci retracement and expansion, which provide reliable and accurate price direction.
Before moving further about the Crab pattern trading strategy, let's have a look at what the Harmonic pattern is.
What is the Harmonic Pattern?
A harmonic pattern is a trading tool that is created from the geometric calculation and Fibonacci ratios. Traders use these rules as both market continuation and reversal indicators.
There are many types of od harmonic patterns in the financial market like- ABCD pattern, Gartley pattern, Bat pattern, Crab pattern, etc. All of these pattern forms look almost the same, but they have some significant differences in Fibonacci calculations.
The harmonic pattern is a competent technical analysis tool that considers the previous price movement and anticipates the future price.
Like other external patterns, a Crab is profitable, and it has years of history to provide a decent trading result.
What Does the Crab Pattern Look like?
In the following section, we will see how a Crab pattern looks like including an exclusive Crab pattern trading strategy.
Want to trade Forex using Crab Pattern with a reliable broker? Open a free account with AtoZ Markets approved forex brokers:
What is the Crab Pattern in Forex?
Crab pattern is a harmonic pattern, which is similar to the Butterfly pattern and Gartley pattern. Crab pattern is used as a reversal indicator. Therefore, it forms at the top or bottom of the price and indicates the potential market reversal. Like other patterns, it starts with four legs- XA, AB, BC, and CD. The pattern begins with point X and ends at point D.
Identify the Crab Pattern in the Forex Charts
Crab pattern forms with the price movement based on Fibonacci calculation, which is similar to the other harmonic patterns.
Let's have a look at what the legs of a Crab pattern represent:
- XA: In a Crab pattern, the first leg is XA, which is the primary counter trend wave. There is no Fibonacci calculation for this leg, but it is vital as other calculations are dependent on it.
- AB: AB forms based on the Fibonacci calculation of the XA leg. Point B can retrace from 38.2% to 61.8% Fibonacci retracement of XA.
- BC: BC depends on the AB leg. It can retrace from 38.2% to 88.6% of AB. However, the Crab pattern will be valid until the point is not breaking above or below point A.
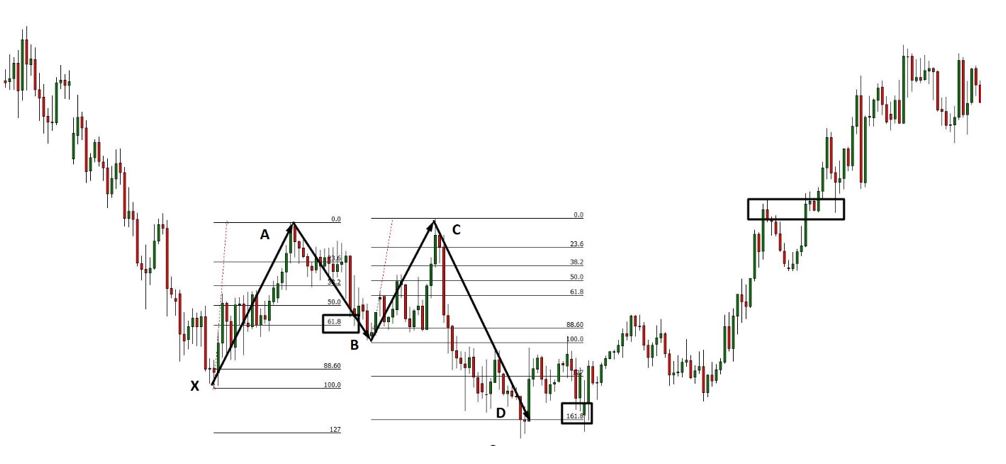
- CD: CD leg completes the Crab pattern, which is the longest leg. CD leg can move 224.0% to 361.8% Fibonacci extension level of BC.
The image below represents how the Fibonacci ratios are implemented in the Crab pattern.

Crab Pattern Rules
In the above section, we have seen how a Crab pattern forms with the specific Fibonacci calculation. However, some rules should not violate in a standard Crab pattern. Let's have a look at these rules:
- Point B will retrace the XA leg.
- Point C should be within the AB leg. If point C breaks above point B, the pattern will be invalid.
- The entry point of this pattern in point D. It should break above or below the point X by creating a new lower low or higher high.
As the crab pattern works as a market reversal indicator, you can trade with it in both bullish and bearish market conditions. You can consider the crab pattern to understand the market context as it provides the potential zone from where the market may resume its major trend or reverse the current trend. Furthermore, this trading tool covers trading entry, exit, and stop-loss levels that makes it useful as an individual trading strategy.
Want to trade Forex using Crab Pattern with a reliable broker? Open a free account with AtoZ Markets approved forex brokers:
Bullish Crab Pattern Trading Strategy
Bullish Crab pattern will appear after a bearish move. If the primary market trend is bullish, it will indicate the continuation of the trend. On the other hand, if this pattern appears at a critical reversal zone, it will work as a significant trend reversal indicator.
Therefore, identify the XA leg after a bearish market and match Fibonacci retracement and correction to find the point D.
In the image below, we can see how a Bullish crab forms after a bearish trend and how to draw the Fibonacci levels to find the point D.
- Entry: Identify the point D and wait for a reversal candlestick to form. Enter the trade as soon as the reversal candlestick closes.
- Stop Loss: Among all points, point D is the lowest. Therefore, put your stop loss below point D. In that case, make sure to use some buffer to eliminate short term market noise. The standard buffer for bullish Crab trading strategy is 10-15 pips.
- Take Profit: The take profit level can differ based on the market condition. The ideal take profit zone is point A. However, you can close a part of your trade if the price reaches point B and move your stop loss at breakeven. In some cases, the market can move upside with a massive speed; it can move beyond point A.

In the above image, we can see how to set the take profit and stop loss levels in the Bullish crab pattern trading strategy.
Want to trade Forex using Crab Pattern with a reliable broker? Open a free account with AtoZ Markets approved forex brokers:
Bearish Crab Pattern Trading Strategy
Identify the XA leg after a bullish market and match the Fibonacci retracement and correction to find the point D.
In the image below, we can see how a bearish crab pattern forms after a bullish trend and how to draw the Fibonacci levels to find the point D.

- Entry: Identify the point D and wait for a reversal candlestick to form. Enter the trade as soon as the reversal candlestick closes.
- Stop Loss: Among all points, point D is the highest. Therefore, put your stop loss above point D. In that case, make sure to use some buffer to eliminate short term market noise.
- Take Profit: The ideal take profit zone is point A. However, you can close a part of your trade if the price reaches point B and move your stop loss at breakeven.

In the above image, we can see how to set the take profit and stop loss levels in the Bullish crab trading strategy.
Summary
Let's summarise the Crab Pattern trading strategy:
- Crab Pattern is a market reversal pattern.
- Point C should not move below or above point A
- D should break below or above point X by creating a new higher high and lower low.
- Make sure to use 10-15 pips buffer at stop loss level.
Besides following the trading strategy accurately, make sure to minimise the overall trade risks by using appropriate money management techniques.
Should you trade Forex using Crab Pattern on your own at all?
Before you start trading with Crab Pattern, you'll want to read this.
Our in-house trading expert Dr Yury Safronau, PhD in Economic Sciences, gives you daily his best forex, metals, and cryptocurrencies to buy and sell signals right now.


His trading strategies which are based on non-linear dynamic models have achieved more than 65 000 pips of profits since 2015. And right now there are some very strong buy and sell signals across several markets you don't want to miss.
Want to see which ones?