October 07, 2020 / AtoZ Markets - Gold remains under the bearish pressure after the Dollar surged following President Trump's comments on Tuesday. The yellow metal will most likely take further beating below the 1865-1850 support zone from the Gold Elliott wave analysis below. However, a break above the 1900-1905 zone should lead to further rally to 1920 and probably 1975 for the commodity. Currently, the price is recovering to the 1900 psychological level. The FOMC meeting today will provide more clues.
President Trump gave a big lift to the Dollar on Tuesday. The White House rejected further stimulus package until after the November 3 election. This came on the same day the Fed Chair Powell advised that the economy needs more stimulus to support the current recovery which has been falling since September. Gold surged to 1921 earlier on Tuesday before Trump's comment. However, a strong dollar pushed the yellow to 1972 before the end of the day. Since September, Gold seems to have shed its safe-haven appeal. The commodity has been on the bearish side since September despite the weakness in the equities markets.
The FOMC coming later today looks rather controversial. The Fed will most likely not announce fresh stimulus after the POTUS' comment on Tuesday. US has recorded the highest number of Covid-19 casualties with over 200,000 deaths. Last month employment data was worse than expected. The Fed are concerned about an economic recovery slowdown amid political tussles in the country ahead of the November 3.
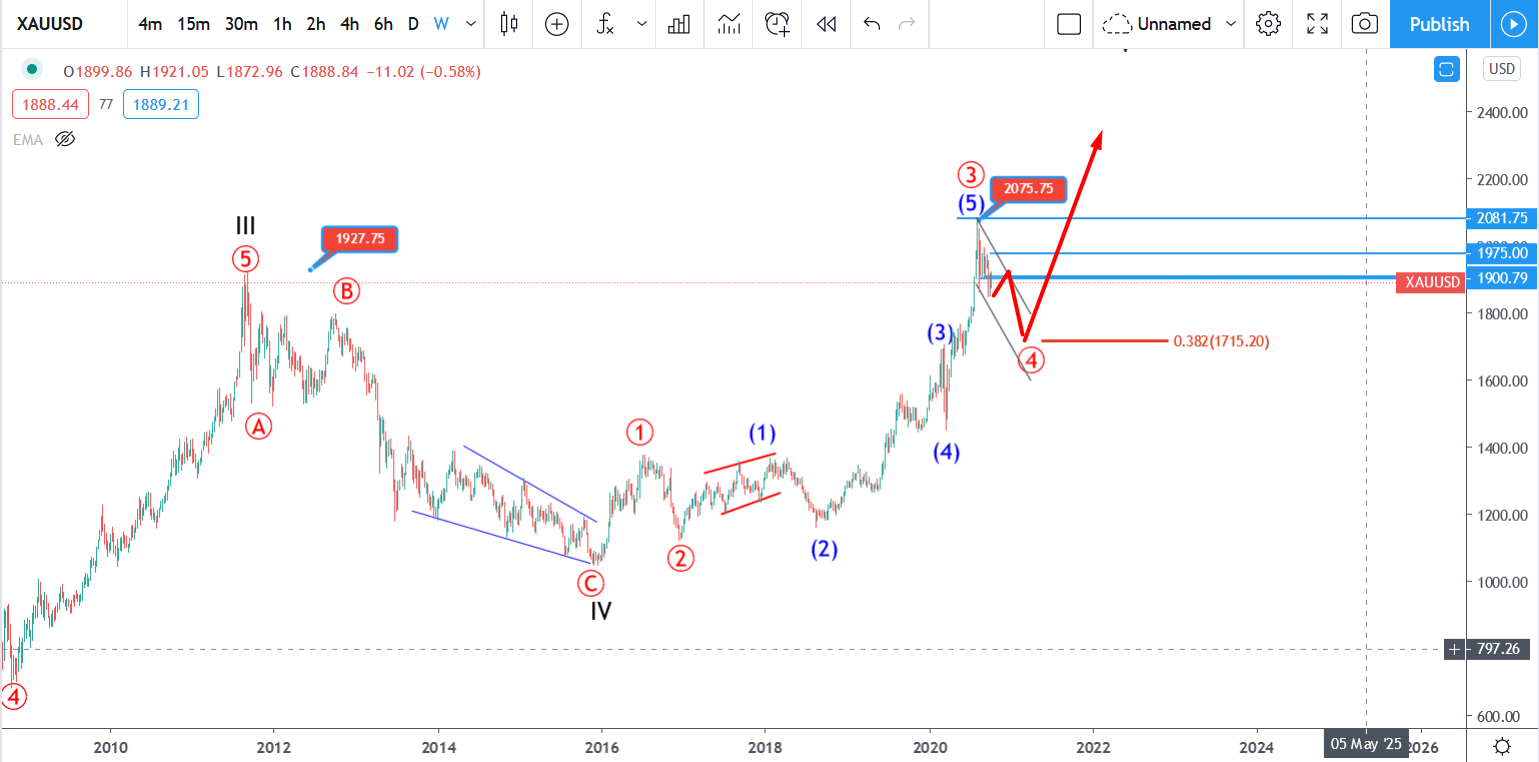
Gold Elliott wave analysis: what next?
The Gold weekly chart above shows the 4th primary wave is emerging on the long-term. At 38.2% retracement of primary wave 3, the 4th wave has room for further decline toward 1700. The recovery in the last two weeks has struggled to build up above the 1900 psychological level. The yellow metal is therefore more likely to fall to the 1800 level in the coming weeks.
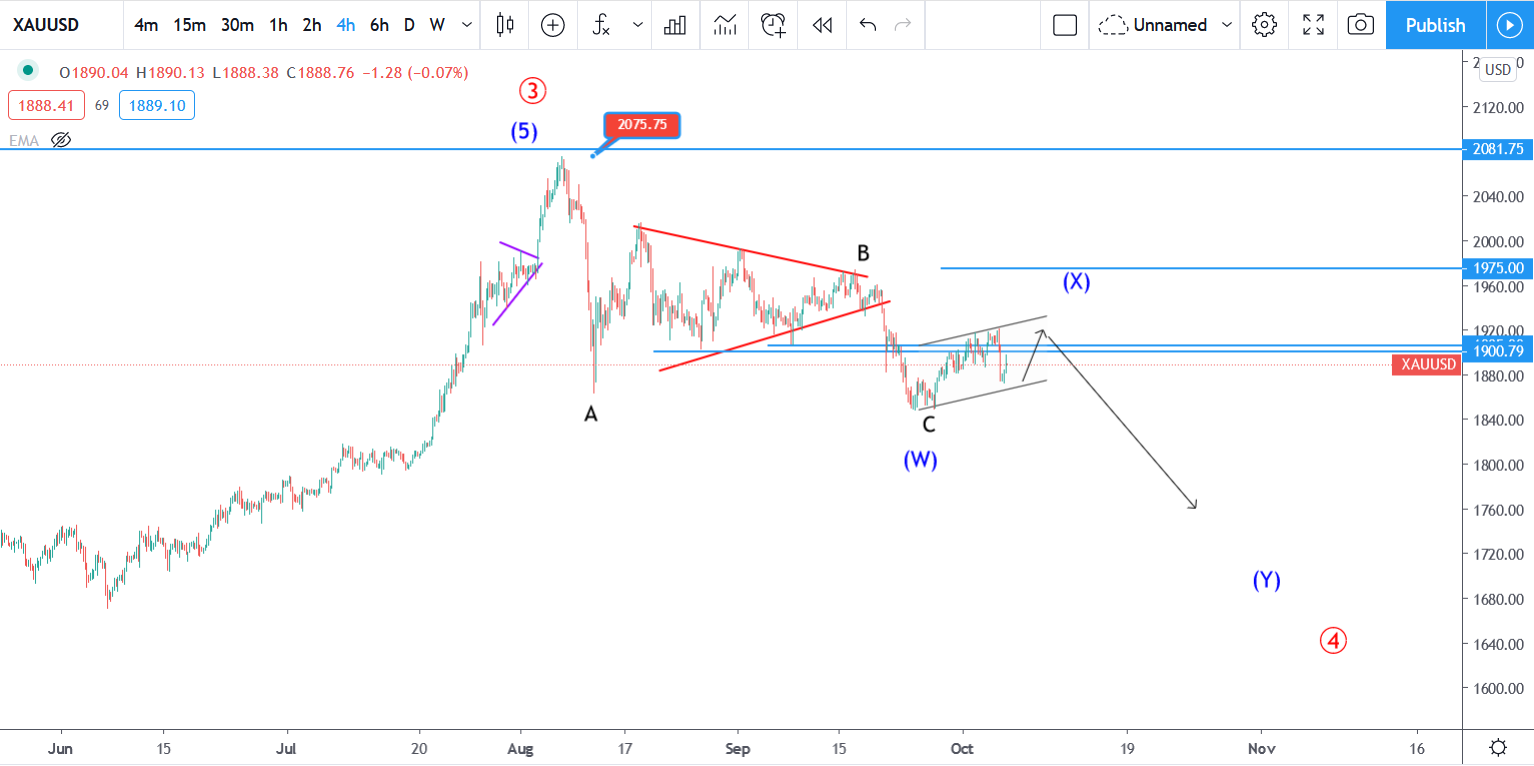
The 4Hr chart above also shows the 4th primary wave emerging into a double zigzag pattern. Wave (X) seems to have ended around the 1900-1905 zone. However, we can not write-off one more bullish leg to 1920 before the final wave (Y) decline. A break below 1847 should see the metal to 1800 first before attempting 1700.