
After a strong dip below $250, Monero rallied back quickly to stay above $300 this month. What should we expect in February 2018? The following February 2018 Monero price prediction suggests XMR/USD possible move next month.
29 January, AtoZForex - In December 2017, XMR rallied to its peak around $470. In just two days, price crashed to $150 resulting in a 68% dip. The last week of December 2017 and the first two weeks in January 2018 saw price recovered most of this drop after a rally to $450. The recovery was good, though couldn't be sustained as another bearish wave rocked the Crypto ship. In the last 2-3 weeks of this month, the market has returned downside. Dropped to $230 in mid January before rallying to $400 and then dropped to $280 on 22nd January. Price is currently at $320 and still short of the $470 peak. That's how price moved this month.
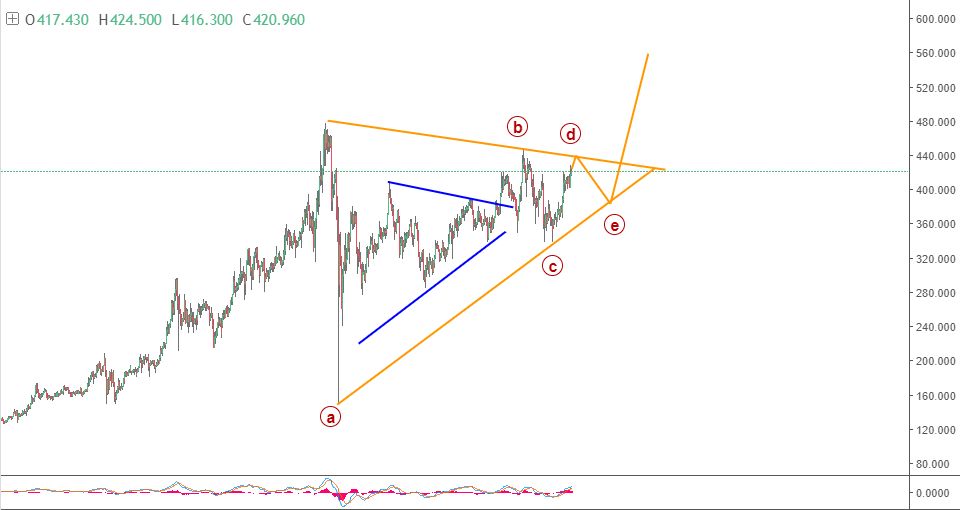
In an the last update, we believed a breakout was close and suggested price could burst upside if the triangle pattern was completed. The chart below was used.
XMR/USD price chart, H2 (click to zoom)
A contracting triangle converging upside means the trend remains upside. There is one more leg down before the breakout. If the breakout happens, a strong rally could follow to $600 or above. Will there be enough bullish momentum to follow through? Only time will tell though it’s a very likely possibility.
What happened afterward? Price couldn't complete the 5th leg before dropping way below expectation. The expected price pattern was invalidated. It seems price is making a bigger triangle pattern as shown in the chart below.
February 2018 Monero price prediction - XMR/USD forecast
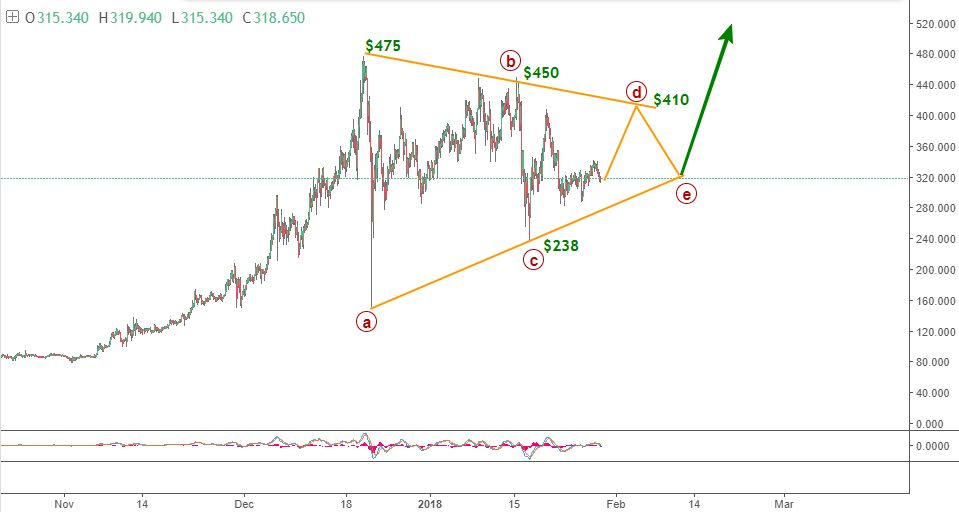 XMR/USD Elliott wave analysis, H2 (click to zoom)


The chart above shows a bigger triangle than what was expected in the last update. There are two more legs to complete this pattern. A rally to $400 and then a dip back to $320 would be enough to complete this pattern. Price could break upside at the completion of this pattern and a rally to $700 could follow. How fast will these happen?. Most of these activities could happen in February unless the Crypto market is silent throughout the month. We will see how that plays out.
Do you have other views in contrast to the ones listed or you want to compliment them further? let’s know by your comment below.
Don’t forget to share this analysis with people that matter to you.