
The EURJPY Elliott wave analysis in this article identifies a clear bearish momentum with trade opportunities for long term and short term traders. Let's look at how Elliott wave theory can help us to identify these trading opportunities.
07 February, AtoZForex - The Elliott wave theory talks about patterns that exist in the technical framework of any publicly traded financial instruments. There are 5 of these patterns namely: Impulse wave, Ending diagonals, Zigzags, Flats and Triangles. These 5 core patterns have variations which all together give 13 patterns. Elliott wave theory also explains how these patterns are in simple ratio ( Fibonacci ratios) to one another. It's as simple as that. These patterns can be vividly seen in Eurjpy since 2000. Let's see the weekly chart below. We will also see if there are trading opportunities based on EURJPY Elliott wave analysis.
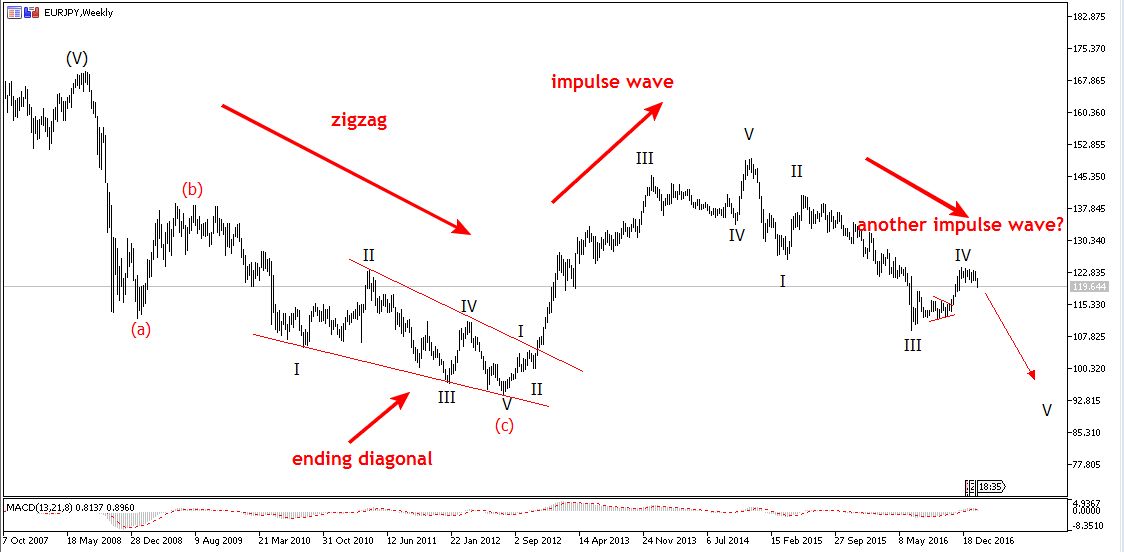 Weekly EURJPY Elliott wave analysis (click to zoom)
In this analysis, we will be focusing more on the patterns than the wave counts. The chart above shows that EURJPY has been exhibiting classic Elliott wave patterns after completing an impulse wave from 2000 to 2008. From 2008, we saw a zigzag pattern with a wave 'c' ending diagonal pattern- very classic stuff. After the breakout of the diagonal, price went on another impulse wave rally. The rally which started in September 2012 and ended October 2014, a period of about 1 year. These patterns signaled sharp and good trading opportunities for long term traders with massive R/R.
Since October 2014, another impulse wave started and has been running till now. Going by the past, it's clear price will continue downside in another 1 year or so. A massive 1500 pips risking less than 500 pips is not a bad investment, is it?.
EURJPY Elliott wave analysis: long term short opportunity?
The recent impulse wave is in wave 4. Impulse wave are sub-divided into 5 waves which means that price may take more leg downside. This is a clue given to us by the wave theory based on how price has been moving since year 2000. But more important to us is the pattern displayed in the 4th wave. The chart below answers that.


 Hourly EURJPY Elliott wave analysis (click to zoom)
The 4th wave is a classic zigzag pattern. After the completion, price went congesting. The breakout of the congestion is an indication that price may continue downside. A good trading opportunity for long term traders to ride the next motive wave downside.
EURJPY Elliott wave analysis: short term trade opportunity?
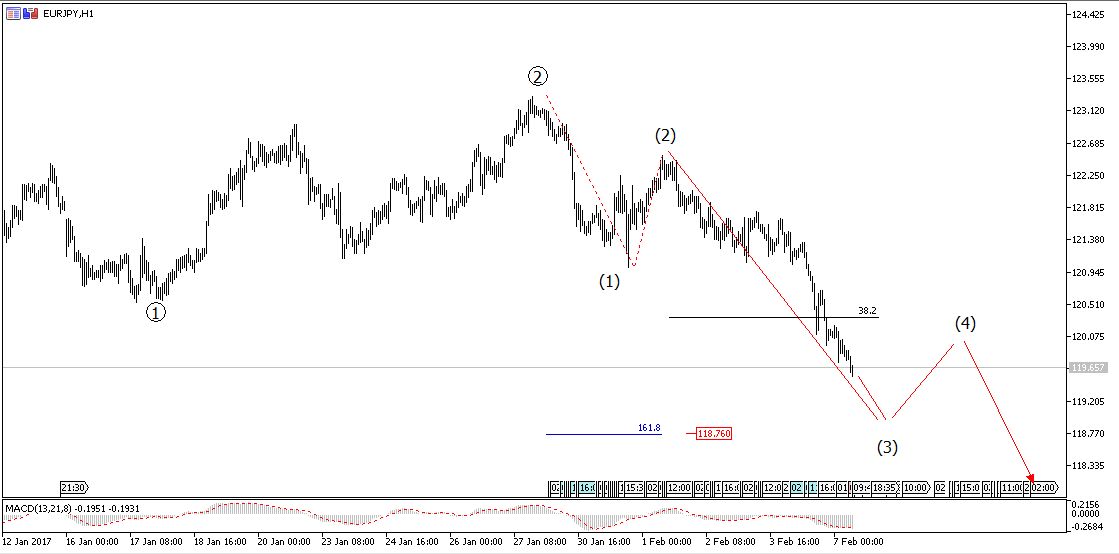
Can there be an opportunity for short term traders on the H1 chart?. Yes, Elliott wave helps to spot reliable wave patterns across all time frames. The chart below shows what short term traders should look at.
 Hourly EURJPY Elliott wave analysis (click to zoom)
The chart above shows the sub-wave of the congestion breakout mentioned earlier. Price is presently in the direction of the 3rd wave of this degree. Wave 3 often extends to 161.8% Fib of wave 1 from wave 2. This will see price to at least 118.76 before a pullback for wave 4. The idea is to wait for a wave 4 pullback corrective pattern for a sell opportunity. Wave 4 often retraces to 38.2% Fib of wave 3- another important information.
The Elliott wave theory isn't perfect but can always give us vital information to have a good edge over the market as has been displayed in EURJPY over 16 years.
If you like this article, please let's know by your comments below. Don't also forget to share on your social media pages.