January 4, 2020, | AtoZ Markets - Dow Jones Industrial Average rose today morning during the Asian session. Dow Jones is currently trading around $30,620 area and trying to push upside. After an extended period of volatility below $30,350 to $30,300 area, the bulls regained momentum and broke above with a bullish gap. As per the current scenario, the price may face strong resistance at the rising wedge in the coming days.
Moreover, DJI hit a record high, while the S&P 500 index climbed around 0.26%, and the NASDAQ Composite index fell 0.01%. Besides, the Intel Corporation (NASDAQ:INTC) is the greatest performers of the session on the Dow Jones Industrial Average, which has risen by 2.52% or 1.23 points to exchange at 49.98 at the nearby. Meantime, Walgreens Boots Alliance Inc (NASDAQ:WBA) climbed by 1.42% or 0.56 points to end at 39.90. Also, McDonald's Corporation (NYSE:MCD) rose by 1.42% or 3.00 points to 214.56 in late exchange.
Dow Jones Industrial Average Hit a Record High as U.S. Stock Performed Well Last Week
DJI is currently residing near $30,620 area and trying to recover higher. The price also found support on the Kijun line and the Tenkan line on the intraday chart.

Image: DJI 4 Hour Chart
According to the 4-hour chart, Dow Jones Industrial Average is currently trading around $30,620 area and trying to recover further. As per the current price action, if the price can break above the rising wedge resistance line impulsively, the bulls may sustain the bullish trend towards $30,900 to $31,000 area in the process. Alternatively, if the price rejects the rising wedge resistance with an impulsive bearish 4-hour candle, the bears may regain momentum and decline towards $30,350 to $30,300 support area in the coming days.
In addition, the dynamic level of 20 EMA is currently residing below the price. Along with the Kijun line and the Tenkan line. So, the dynamic level may act as a strong support to push the price upward. Besides, the Kijun line and the Tenkan line may work as a confluence of the dynamic level in the process.
DJI May Face a Strong Resistance
According to the daily chart, Dow Jones Industrial Average hit an all-time high and currently residing near $30,620 area. As per the current price action, if the price can have an impulsive daily bullish candle close above $30,300 to $30,350 support level, the bulls may push the price upward towards $30,900 to $31,000 area. So, if the price reaches $30,900 to $31,000 area and rejects with a bearish candle close, the bears may regain momentum and decline towards $30,350 to $30,300 area again in the days ahead.
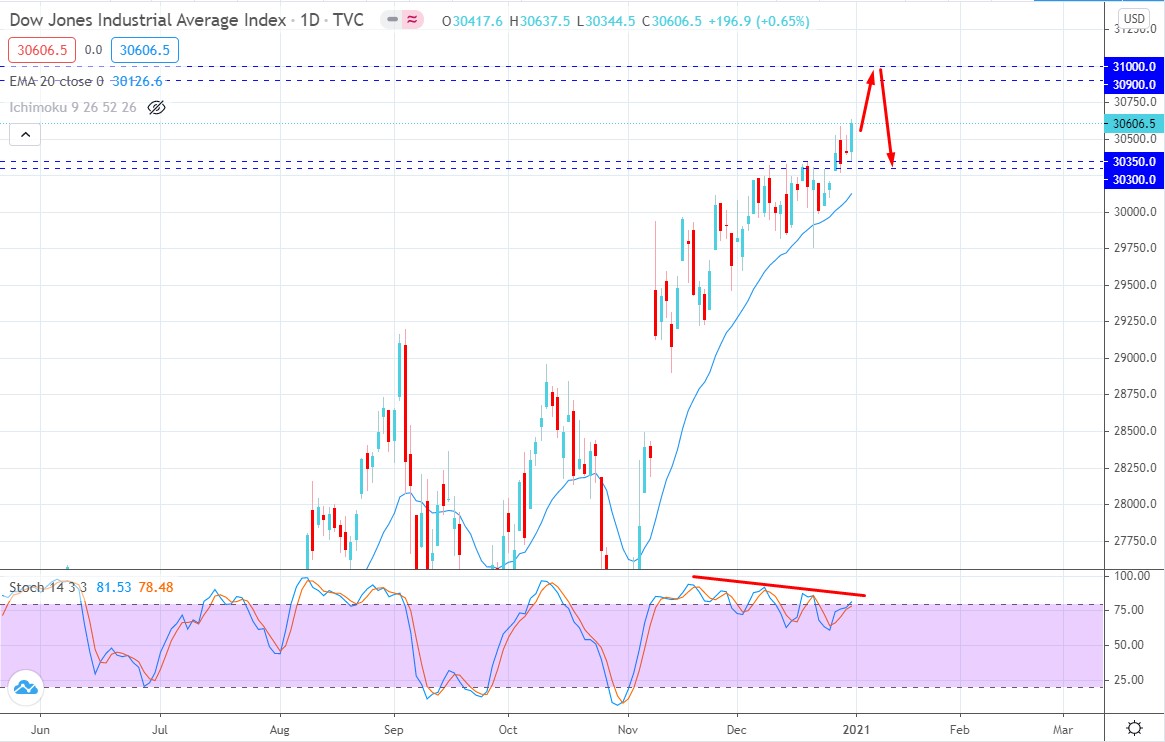
Image: DJI Daily Chart
Furthermore, the dynamic level of 20 EMA is currently residing below the price. It may pull the price down as a mean reversion. Along with this, the Stochastic Oscillator lines are currently residing near the overbought level 80 and gradually sloping downside. It indicates that bears may regain momentum in the coming days.


To conclude, after an extended period of volatility, the dynamic level carried the price as strong support and helped to break above the psychological resistance. A daily close will help to identify the definite momentum in the days ahead.