
April 14, 2021, | AtoZ Markets - Amazon is currently trading around $3,400 price area and trying to push downside. After bouncing from $3,000 to $3,050 support level, the bulls have regained momentum and pushed the price upside towards February 2021's high. As per the current price action context, the price may face strong resistance around $3,000 to $3,430 price area in the coming days.
Moreover, authorities with the National Labor Relations Board (NLRB) will keep calculating voting ballots on Friday in the firmly watched union political election at an Amazon.com Inc. stockroom in Alabama, Bessemer, after allies of the executives took an early lead.
Amazon Found Resistance at the Significant Event Level
Amazon is currently residing near $3,400 price area and trying to decline. However, after an extended period of volatility, AMZN bulls have successfully regained bullish momentum.

Image: AMZN 4 Hour Chart
According to the 4-hour chart, Amazon found resistance and currently trading around $3,400 price area. As per the current scenario, if the price can have a bearish candle close below the last candle's low, AMZN may retrace towards $3,300 to $3,280 price area in the coming days. So, if the price retraced towards $3,300 to $3,280 price area and bounced upward with a bullish candle, the bulls may push the price higher towards $3,400 to $3,430 price area again in the days ahead.
In addition, the dynamic level of 20 EMA is currently residing below the price. So, it may pull the price down as a mean reversion. Also, the Stochastic Oscillator lines are currently residing above the overbought level 80 and having a bearish intersection. It indicates that the price may retrace downside in the process.
AMZN May Sustain the Bullish Pressure
According to the daily chart, Amazon found resistance, but the overall bias is bullish. As per the current price action, if the price can have a daily bearish candle close below $3,430 to $3,400 price area, the price may retrace towards $3,300 to $3,280 support area in the process. So, if the price retraced towards $3,300 to $3,280 support area and bounced higher with a daily bullish candle, the bulls may push the price upside towards $3,400 to $3,430 price area as a first target. The second target will be $3,550 to $3,600 price area if the price can break over $3,400 to $3,430 price area in the coming days.
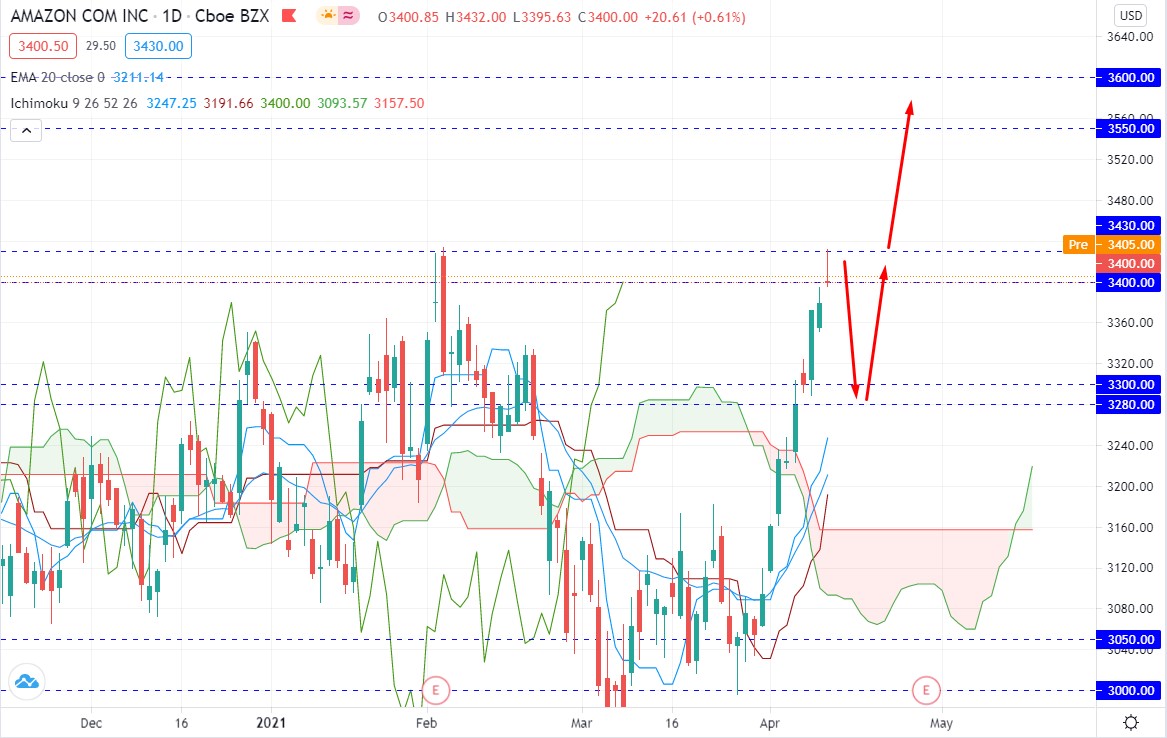
Image: AMZN Daily Chart
Along with this, the dynamic level of 20 EMA is currently residing below the price. Along with the Kijun line and the Tenkan line. So, the dynamic level may hold the price as strong support. Besides, the Kijun line and the Tenkan line may work as a confluence of the dynamic level in the process.


To conclude, after an extended period of bullish momentum, the price requires a downside retracement. A daily close will help to identify the definite momentum in the coming days.