
At the beginning of this week, we looked at where is highly probable for the bullish trend to halt for a bearish correction. The following look at two scenarios and what we could do next based on 31 May Gold Elliott wave analysis.
31 May, AtoZForex - It's pretty clear that the next expectation for Gold is a bearish correction, despite gold climbed the third consecutive week. The bullish trend is not violated yet and intraday sellers can wait to take advantage of the imminent bearish correction. Meanwhile, swing buyers can wait to buy the dip.
In overall, it meansdDifferent strokes for different folks. As the Elliott wave can help all folks of traders to make good trading decisions. The chart below was used in the last update.
 Gold Elliott wave analysis, H2 (click to zoom)
The chart above shows the possibility for more rally before an eventual bearish correction. At the end of an impulse wave, a 3-wave correction follows. Price is in the 5th wave of the impulsive rally. Projections are made to 1280 and 1300. Price could reverse at any of these prices. At the breakout of the 5th wave channel, we could have the first confirmation of a bearish correction toward to 1230-1240 region. This could be another top picked and a bearish opportunity for sellers. The overall trend remains upside and price should resume at the end of the correction.
Price was expected to rally to 1280 before looking for bearish clues. At the moment, there seems to be a huge divergence in price and momentum. This gives us a an alternative scenario - the bearish trend may not get to 1280 before going down. How probable is this?
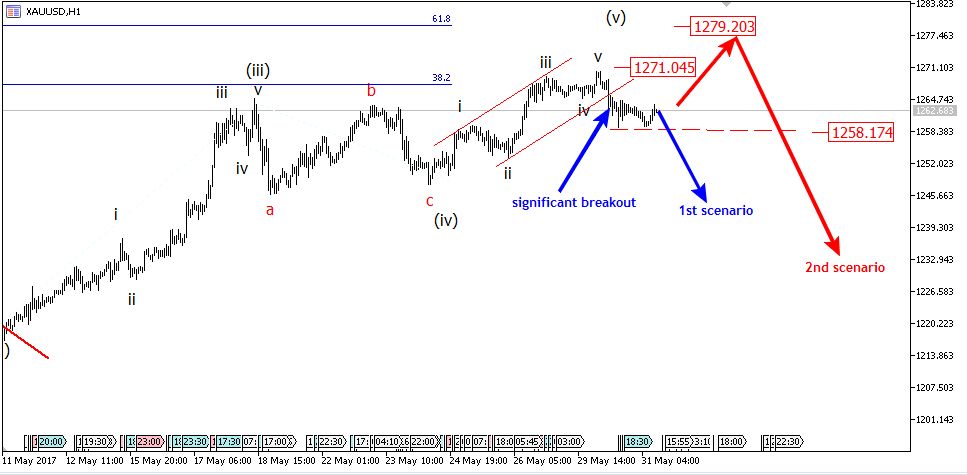
31 May Gold Elliott wave analysis: two scenarios
 Gold Elliott wave analysis, H1 (click to zoom)


Sometimes, the projection of wave 1-3 from 4 completes wave 5 at 38.2% especially if the 1st wave is very small and the 3rd wave is extended. Price completed the 5th sub-wave below 1271 and there was significant breakout. After breakout, price had an intraday bottom at 1258. The break below 1258 will confirm the 1st scenario. If price rallies to break above 1271, the 2nd scenario will lead price to 1280 before looking for bearish clues. If price remains below 1271 and breaks below 1258, more dip could be seen to 1225. More updates will come later.
Do you have other views in contrast to the ones listed or you want to compliment them further? let’s know by your comment below.
Don’t forget to share this analysis with people that matter to you.