
Gold hit a resistance last week after completing an impulse wave. Price is being held below 1264 followed by a small bearish correction. How deep will the correction go?. Based on 3 April Gold daily Elliott wave analysis, we look at the intraday Elliott wave analysis of Gold prices.
03 April, AtoZForex - In the last update on Gold, we identified a strong resistance after price completed what looked like an impulse wave upside. According to Elliott wave theory, an impulse wave is followed by corrective wave. Impulse waves are made up of 5 sub-waves while corrective waves are broken down to 3 sub-waves except triangle that subdivides to 5 sub-waves. We expected price to correct downside before a probable bullish resumption. In the chart below used in the last update, the impulse wave is seen to have completed at the strong resistance.
 Gold Elliott wave analysis, H2 (click to zoom)
The impulse wave is now probably complete at a strong resistance. Often times, reversal patterns complete at a strong resistance or support. The resistance also coincides with some Fibonacci projected ratios. We could see a bearish retracement (at the minimum) in the coming days. If price remains below the resistance zone and breaks below the the rising trendline, intraday sellers can take advantage of the correction downside. The correction may get to 1220.53 or below. If the bearish move is not corrective, a dip below 1194 will mean that the bullish trend will be on hold
There was a breakout and price moved down. The dip isn't as deep as expected at the moment. Price movement looks corrective. Looking at the intraday wave count, we have two scenarios. These scenarios show the levels to watch out for.
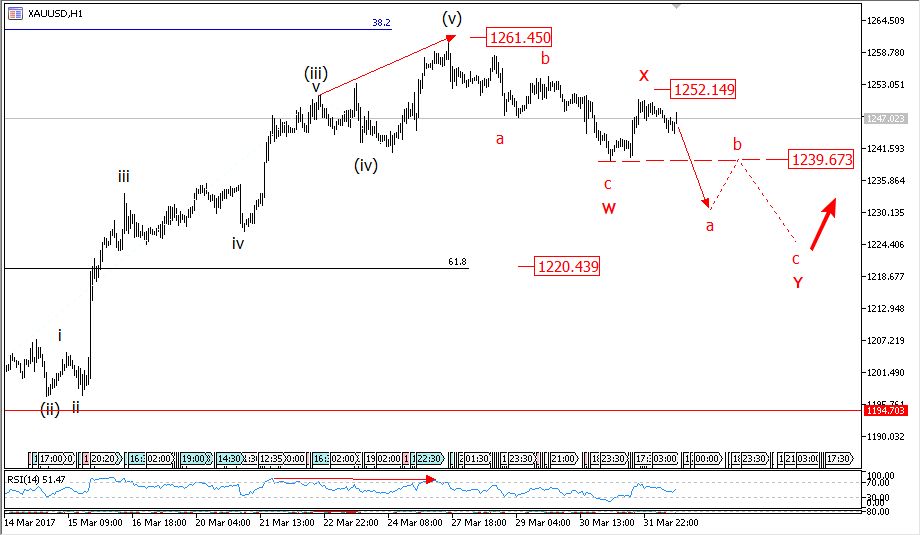
3 April Gold daily Elliott wave analysis: first scenario
 Gold Elliott wave analysis, H2 (click to zoom)
The correction is expected to go toward 1220.4. The present correction is so shallow to be a major correction of an impulse wave. If price rallies above 1252 powerfully, there is a high likelihood of further push above 1261.45 and the second scenario below will be set. The first scenario is preferred. The chart below also shows a head and shoulder reversal pattern.


 Gold Elliott wave analysis, H2 (click to zoom)
Short term sellers can hold on to their position if price breaks below 1239.67 neckline of the reversal pattern shown above. We have projected a double zigzag pattern downside if price stays below 1252 and break below this neckline.
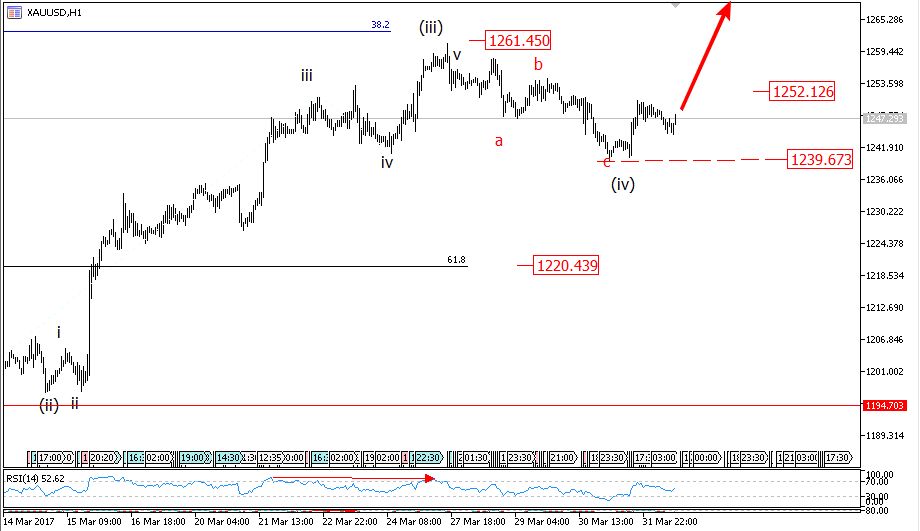
3 April Gold daily Elliott wave analysis: second scenario
 Gold Elliott wave analysis, H2 (click to zoom)
If price stays above 1239.67 and break above 1252, it's likely that the impulse wave is not complete yet. A rally above 1261.45 can't be ignored in this case. These levels are very important to confirm where next price will head in the short term.
Do you have other views in contrast to the ones listed or you want to compliment them further? let’s know by your comment below.
Don’t forget to share this analysis with people that matter to you.