
In the first half of this month, Bitcoin lost about 40.5% at $2960 after it was about hitting the $5000 mark. A loss of more than $2000 (40.5%) in half-month underlines the volatility in this market. The second half of the month has seen price rallied back to $4200 gaining 45.2%. Overall, in September, BTC has lost about 15% so far though still made a huge recovery. The drop from $4980 is the largest this year so far. Can it go down further or the recovery will continue and break above the $5000 mark?
From the Elliott wave theory perspective, the September dip is a correction which often happens after the completion of a motive wave. It's important to know which corrective pattern is surfacing. The chart below shows the bullish trend of BTC this year.
Want to trade with a reliable exchange? Open a free account with AtoZ Markets approved crypto exchanges:
29 September Bitcoin Elliott wave analysis
 BTC Elliott wave analysis, H4 (click to zoom)
The chart above shows an impulsive wave drive that dominated this year. The September correction is likely to go deeper with a double zigzag in sight. The recent recovery (2nd half of September) is the wave (x) of the double zigzag. If this wave count is correct, price will go deeper to complete wave (y) and in the process complete the 2017 cycle. The recovery is expected to continue to $4630. The chart below shows this clearly.
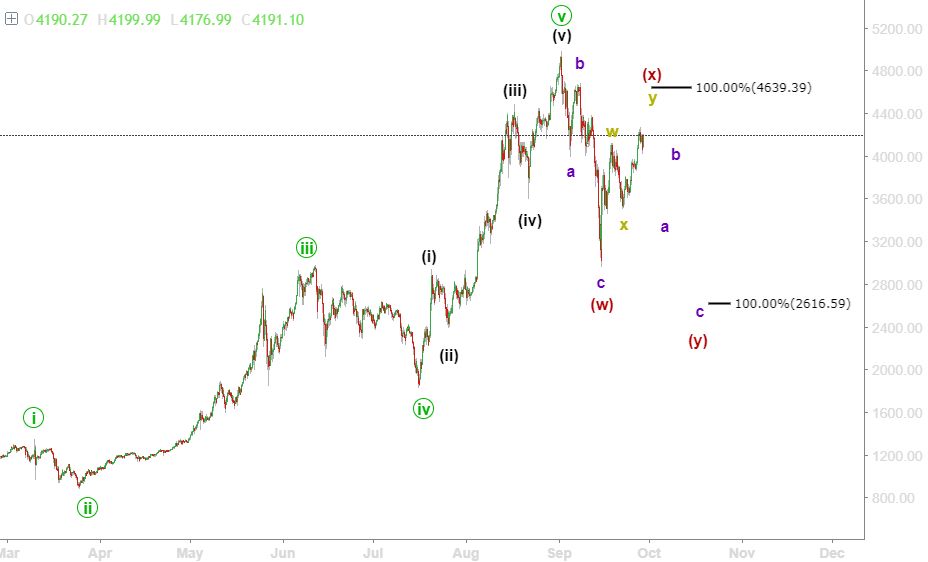
 BTC Elliott wave analysis, M30 (click to zoom)
The chart above shows that wave (x) could also end up as a double zigzag. 4540-4670 is the next level to watch out for . If price breaks above this level with a high momentum, there is a strong chance that the move will break above $5000. A rejection otherwise, will cause price to dip even lower in another series of losses down to $2600. At $2600, if this forecast plays out, we can say an Elliott wave cycle is complete in 2017. At the end of his, a new era that would drive BTC above $10000 is very likely.
Should you trade cryptocurrencies on your own at all?
Before you start trading cryptocurrencies, you'll want to read this.
Our in-house trading expert Dr Yury Safronau, PhD in Economic Sciences, gives you daily his best forex, metals, and cryptocurrencies to buy and sell signals right now.


His trading strategies which are based on non-linear dynamic models have achieved more than 65 000 pips of profits since 2015. And right now there are some very strong buy and sell signals across several markets you don't want to miss.
Want to see which ones?