
25 January, AtoZ Markets- In the last update, we did a comprehensive analysis of Gold from the weekly chart to the hourly. We noticed that the bullish trend has resumed after last month breakout. On the intraday front, we expected a bearish correction before the bullish trend resumes. We used the hourly chart below and expected price to be contained below 1220.
 Hourly Gold Elliott wave analysis (click to zoom)
We also recommended that :
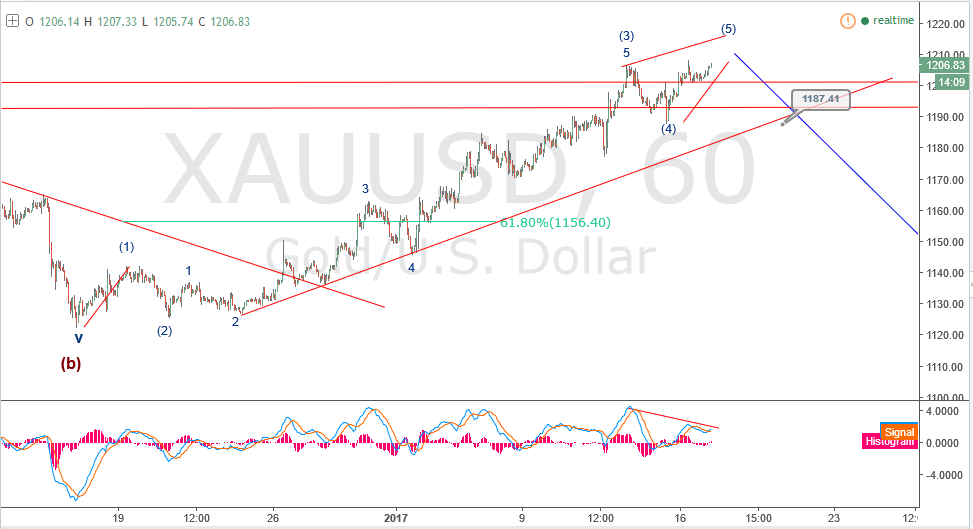
A bearish correction will be expected to 1156.40 or 1160 IF price breaks below 1187.4 and below the rising trendline.
What happened next? Price dipped toward the trendline and bounced up to form what could later be a double top.
If you want to trade Forex using Elliot Wave strategy with a regulated broker, open an account with any of the below brokers:
25 January Gold Elliott wave analysis: imminent breakout?
We will combine the 25 January Gold Elliott wave analysis with other technical tool to decipher what next to expect. The chart below shows that the impulse wave rally is almost complete.
 Hourly Gold Elliott wave analysis (click to zoom)
The impulse wave completed just below 1220, then a dip and a rally back to the top. With the recent dip breaking below the trendline in the last update, a double top is forming. The neckline of this classic chart pattern is just above 1194.35. A breakout below 1194.35 will be a good opportunity to short- this ensures that hasty entry is avoided. With price heading to 1150, the risk reward ratio is more than 1:1 . The R/R will even be better considering the possibility of a deeper correction.
Elliott wave theory has shown over and over again of its flexibility. The theory can be used with other old and new technical methodologies. In future articles, we will show you live examples to support this fact. So anyone can use the wave theory- with harmonic patterns, indicators and divergences, chart patterns, candlestick price actions etc.
We will see how Gold plays out after breaking the double top neckline in the coming days. This is a possibility of high likelihood. It must be noted that technical analysis is not perfect. It is only important to look for what can give us the edge of winning and technical analysis is the answer if we learn to use it well and accept the risk.
Should you trade forex using Elliot Wave strategy on your own at all?
Before you start trading with Elliot Wave strategy, you'll want to read this.
Our in-house trading expert Dr Yury Safronau, PhD in Economic Sciences, gives you daily his best Forex, metals, and cryptocurrencies to buy and sell signals right now.


His trading strategies which are based on non-linear dynamic models have achieved more than 65 000 pips of profits since 2015. And right now there are some very strong buy and sell signals across several markets you don't want to miss.
Want to see which ones?