
The year 2017 has one more week to go. We want to see how Gold could behave in the coming week as we round off the year to prepare for a new one. The following analysis is based on 25-29 December Gold Elliott wave analysis.
23 December, AtoZForex - On the 25th-26th December, there may not be much activities in the market. On 25th, banks are on Holiday and so will many traders for the Christmas holidays. So this forecast should cover for the last week of December and the first week of January 2018. There will be updates at any time within if there will be needs for.
For several weeks, we have been looking at Gold bearish move. We already established the fact that the dip since September is corrective. Once this correction is over, there is a high tendency that price will soar to 1400-1500. In the last update, we suspected that the dip could continue to 1220 or even 1200 as shown by the chart below.
Gold Elliott wave analysis, H1 (click to zoom)
The chart above shows the emergence of an impulse wave at the 3rd sub-wave. The 3rd sub-wave is about ending at 1235 (161.8% Fib-projection of wave i from ii). A 4th wave rally could be seen to 1252 or 1262 before the bearish move continues. A double zigzag could also emerge with the first zigzag (wave w) ending at 1236 and price rallying to 1262 for wave x. A drop to 1220 or 1200 is expected after the correction.
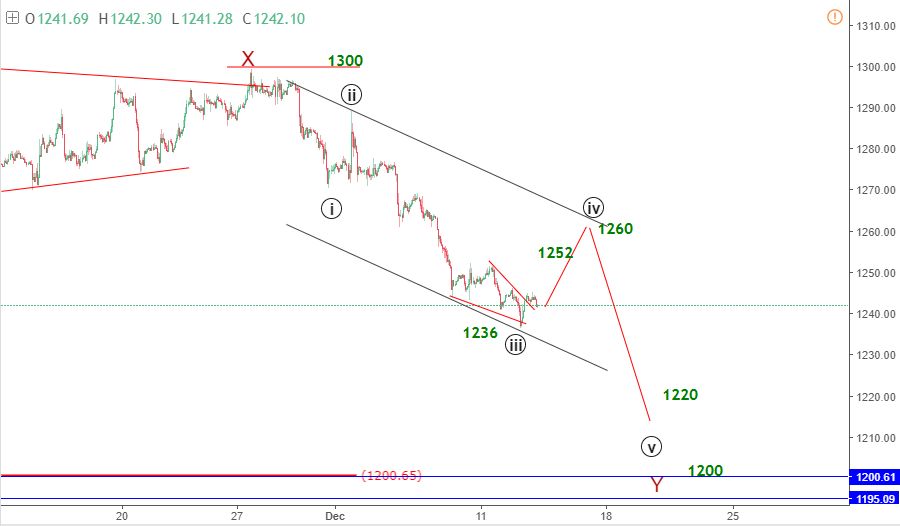
Price rallied as expected but couldn't be resisted at 1260-62 thereby invalidating our expectation that the bearish move would continue. 1236 as well as 1200 are important reversal zones for wave Y of the bearish double zigzag. The chart below explains better with new two scenarios for the coming weeks.
25-29 December Gold Elliott wave analysis: XAUUSD forecast
 Gold Elliott wave analysis, H4 (click to zoom)


The chart above shows the bearish zigzag/double zigzag correction since September. 1239 and 1201 are 61.8% and 100% Fib projection respectively of wave w from x. Price was meant to reverse at any of these two levels.
1st Scenario
With price bouncing off 1239, wave Y could have completed. A break above the trendline should confirm the first scenario (in black). Waiting for a pullback to the trendline could be an ideal method to join the bulls. If price plays out this scenario, we may see it advancing to 1400. If price bounces off the trendline and drops significantly down, the second scenario might play out. This scenario will be invalid below 1239.
2nd Scenario
A refusal to break above the trendline could mean wave Y will extend to 1201 reversal level (as shown in red). It's important to wait for a significant bearish move off the trendline and then look for selling clues at retracement. The drop could continue to 1201 before the bearish corrective pattern ends. Stay tuned for the next update. Happy holidays.
Do you have other views in contrast to the ones listed or you want to compliment them further? let’s know by your comment below.
Don’t forget to share this analysis with people that matter to you