
The Cable, from a long term perspective, is probably completing a pattern that would lead to a bearish crash. The following look at the Cable from a long term perspective based on 23 May GBPUSD Elliott wave analysis with 1000 pips bearish potential.
23 May, AtoZForex - GBPUSD for majority of the last 3 years has dropped. This moment include BREXIT and the US election. It was almost clear at a point that GBP could be running to parity with USD. The dip since 2014 is clearly exhibiting the structural identity of an impulse wave. It does look like this pattern is not complete yet and it's a matter of time before the Cable falls again. What will trigger might not be visible now but when this is done, there will definitely be an explanation from fundamental experts. With Elliott wave theory, we can see ahead of others while we prepare ourselves for moves of the highest probability. Let's do some long term review and projections.
23 May GBPUSD Elliott wave analysis: weekly
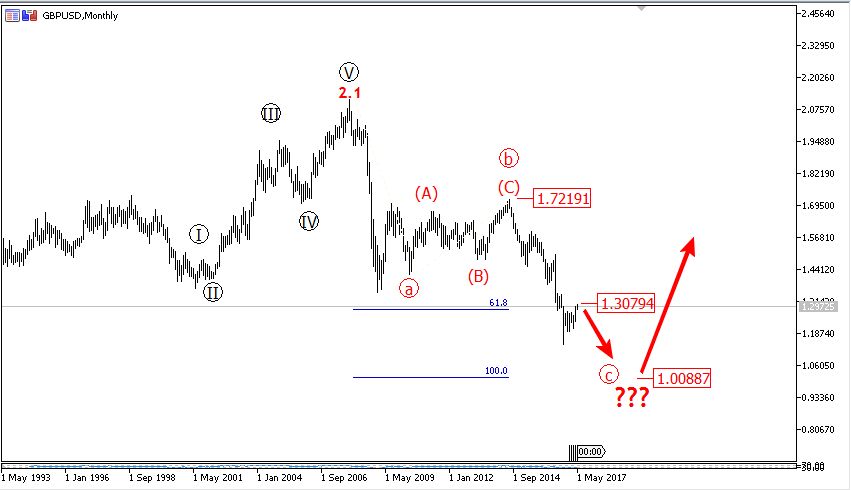 GBPUSD Elliott wave analysis, Monthly (click to zoom)
23 May GBPUSD Elliott wave analysis: daily
The chart above shows the dip from 2007 when the price of GBP was double that of USD. 10 years after the USD rallied and caught up. The GBP on the other hand fell drastically in just about a year from 2017 to 2018/Jan 2019 before going on a correction that lasted for many years. The dip continued in 2014 and greatly enhanced in 2016 by big events. The fall from 2.1 is clearly a zigzag pattern. That's the pattern exhibited. More often than not the wave C of a zigzag pattern extends to 100% Fib-projection of wave A. This will happen at 1.0087 or simply 1.0- parity. The C-wave, expected to be an impulse wave, does not seem to have completed yet. There is still room for another bearish crash. The chart below shows the sub-wave of C.
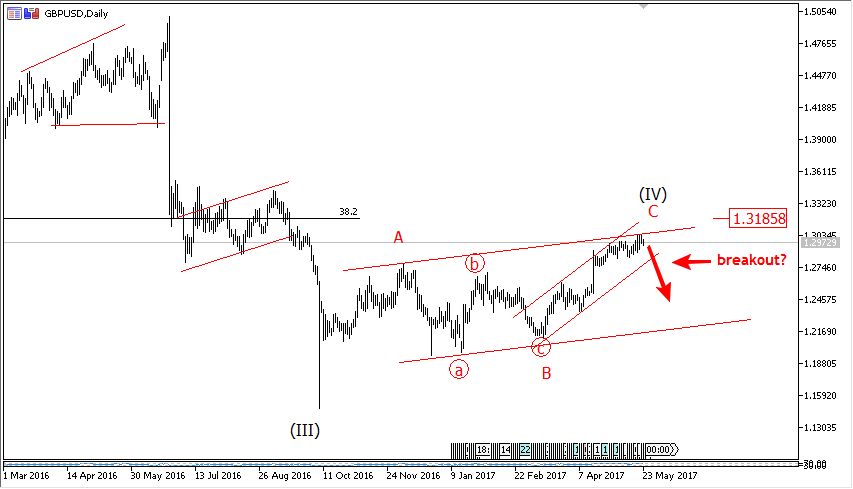 GBPUSD Elliott wave analysis, Daily (click to zoom)
The chart above shows the rally from 2016 as wave (IV) of the long term bearish impulse wave. Wave (IV) shows a zigzag pattern about to complete. The wave C of (IV) should be an impulse wave. Price could extend further to 1.318 (an important fib-level). The chart below shows the sub-waves of C of (IV).


23 May GBPUSD Elliott wave analysis: 1000 Pips potential?
 GBPUSD Elliott wave analysis, H4 (click to zoom)
Price is at the verge of completing an impulsive wave C of (IV). 1.3182 and its neighborhood has been projected to the impulse wave to complete. A significant break below the channel could lead to price falling for 1000 Pips or more. More updates will come later.
Do you have other views in contrast to the ones listed or you want to compliment them further? Let me know by your comment below.
Don’t forget to share this analysis with people that matter to you.