
EURUSD was involved in some spiky moves in the later part of last week with the bears prevailing. The week has seen a bearish continuation so far. It does look like price will go down further to complete a 700 Pips dip. Why do we think so?. The following discusses complete patterns based on 21 June EUR USD Elliott wave analysis that could call for this.
21 June, AtoZForex - It's been long we haven't made an update on EURUSD. We just wanted to be clear of what price was trying to establish before deciding on the next direction of our bias. We called for bullish resumption early late last month/early this month recommending buying the dip after price was being held upside by some bullish pressure. There is now something clear which will be shared with you shortly. Price could probably have completed a significant part of a long term bullish correction. The rally since December 2016 looks corrective and could be the start of a strong fall. Let's review the last update before we proceed. The chart below was used.
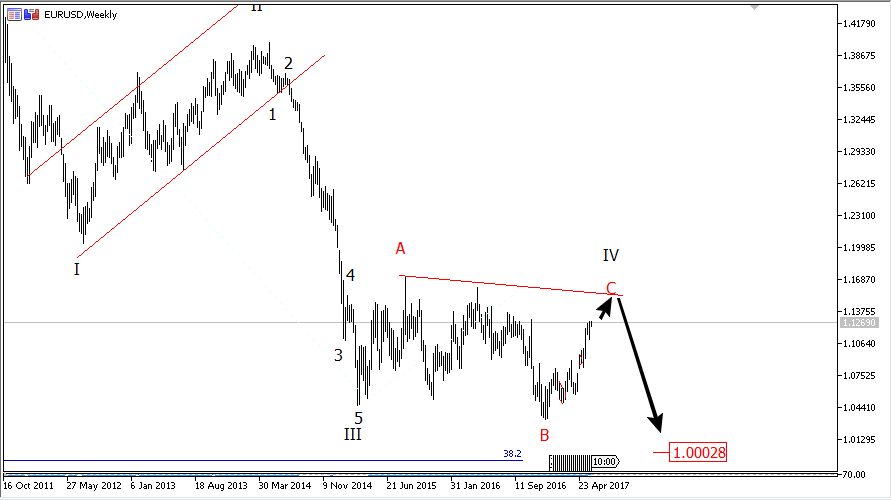 EURUSD Elliott wave analysis, Weekly (click to zoom)
The weekly chart above shows the possibilities of more rally to 1.15. This is expected to be the long term 4th wave. The move from 2014 has been sideways- a corrective structure. The pattern also shows the build-up of a Flat pattern.
If the long term correction will be a flat pattern, wave C is expected to be a motive wave- impulse wave most probably. The chart below was used to project an impulse wave.
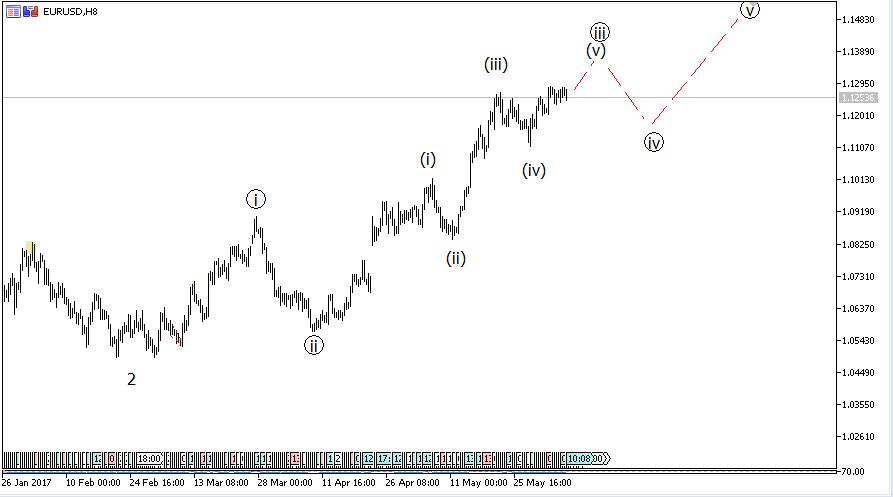 EURUSD Elliott wave analysis, H8 (click to zoom)
Based on the chart above, it will be a good decision to wait for the next pullback – wave 4 (circled) before buying again. A strong break below 1.11 could hamper the bullish move and take us back to our last forecast.


Price rallied to 1.13 before breaking downside to 1.11. What was expected to be an impulse wave is looking more corrective - double zigzag precisely. That's a big concern. A long term Flat correction may be violated and transformed to an emerging triangle pattern as shown below.
21 June EUR USD Elliott wave analysis: new long term view?
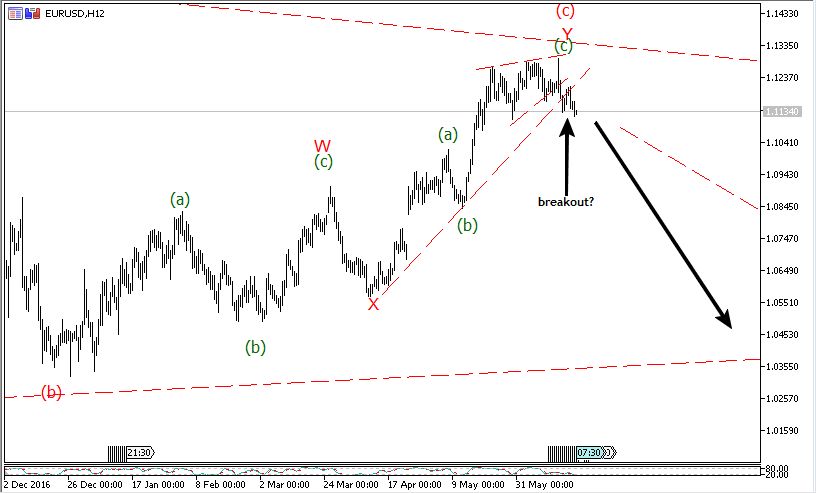
 EURUSD Elliott wave analysis, H12 (click to zoom)
The above is a triangle forecast in the long term. If this plays out, price will dip toward 1.04 which is 700 Pips away. If price should complete this setup and validate it, it would mean a bad periods for the Euro markets. The chart shows a closer look to a bearish setup to take this 700 Pips probable dip.
 EURUSD Elliott wave analysis, H12 (click to zoom)
That's the double zigzag complete instead of the impulse wave. At breakout of the diagonal mouth below 1.11, the Euro could start a strong dip to 1.04 and you don't want to miss it. The R/R is so huge. This setup will be invalid if price breaks above 1.13. More updates will come later.
Do you have other views in contrast to the ones listed or you want to compliment them further? let’s know by your comment below.
Don’t forget to share this analysis with people that matter to you.