
Gold, for many years, has been one of the most predictable instruments. When the technical patters are clear, Gold doesn't hesitate moving in the direction of forecast. The following discusses about a potential intraday breakout bearish setup based on 20 May Gold Elliott wave analysis.
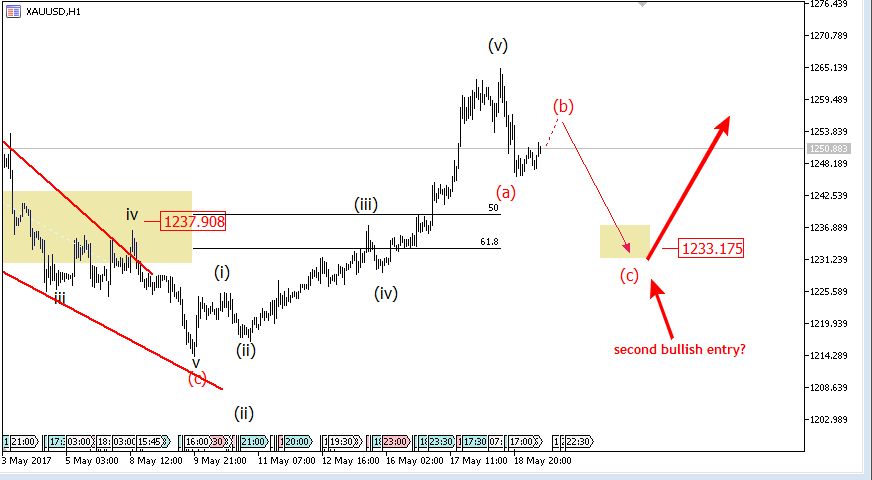
17 May, AtoZForex - Technical analysis including Elliott wave theory is not perfect. We will be right and wrong every time. In spite of this fact, there are some instruments that tend to be more predictable than others with Elliott wave theory. Gold has been exhibiting clear patterns for decades to the extent that we can even forecast into the future with a far bigger than average accuracy expectation and confidence. In the last update, after a successful bullish run call, we called for a possible corrective dip toward 1233 before the rally probably resumes. The chart below was used.
 Gold Elliott wave analysis, H1 (click to zoom)
The chart above shows the sub-waves of the breakout-an impulse wave. This makes the bullish setup more reliable and the breakout more significant. The first entry was at breakout. It’s good to have more than one entry plan. A 3-wave intraday correction could be seen at 50% Fib-retracement of the breakout rally. A new bullish entry should be viable at 50% retracement as shown in the chart below. The invalid level is at 1212.
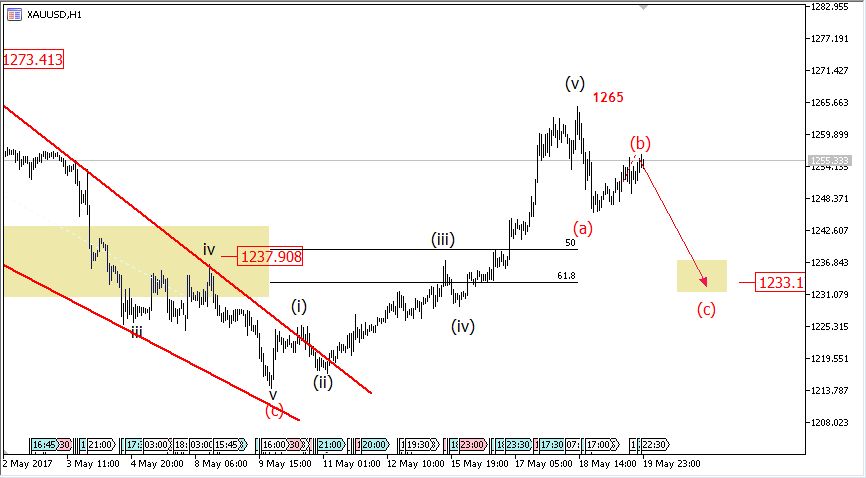
After peaking at 1265, it was just normal to look for a bearish pullback. This bearish correction would be a zigzag or double zigzag pattern - zigzag more probable. Price completed wave (b) of the bearish correction as shown below.
 Gold Elliott wave analysis, 15M (click to zoom)
If price stays below 1265, there is a high likelihood that price will break downside to complete the last leg of the (a)-(b)-(c) correction . At the end of the correction, swing and long term buyers can look for opportunities. One good thing about the wave theory by R.N Elliott is that : opportunities can be gotten in all time frames. Can there be a way to sell to (c)? you though right?. Check the chart below.


20 May Gold Elliott wave analysis: 200 Pips bearish setup?
 Gold Elliott wave analysis, 15M (click to zoom)
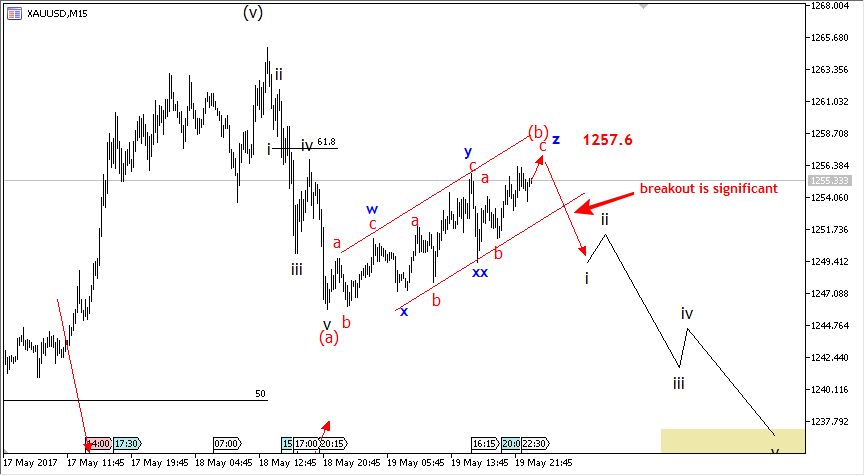
The chart above shows that sub-waves of (b) and the corrective pattern exhibiting. There is a formation of a triple zigzag. Yes!. A triple zigzag on the 15 minutes time frame for short term and intraday sellers. A break below the triple zigzag channel could present a bearish opportunity to 1233 and intraday/short-term sellers can take advantage. This will be perfect if price stays below 1257. Any high momentum rally above 1257 and 1265 will invalidate this intraday setup and take price higher. More updates will come next week.
Do you have other views in contrast to the ones listed or you want to compliment them further? let’s know by your comment below.
Don’t forget to share this analysis with people that matter to you.