Gold has dropped more than 600 pips since it topped at 1365. The following 2-4 May Gold Elliott wave analysis looks at the long, medium and short term Elliott wave forecast of XAUUSD.
02 May, AtoZMarkets - Since 25th January, Gold has remained between 1366 (range high) and 1301 (range low). Is this a kind of a range from the daily time frame or price is just forming a strong congestive resistance zone for a strong dip? Last month Gold hit 1365 (close to 1366 top) and has now dropped more than 600 Pips to trade close to 1301 support. Will price break below the 1301 support for a wild bearish move or rally toward the range top at 1366? In the analysis below, we will look at this from Elliott wave theory perspective and make long and medium term forecasts.
The chart below shows the long term wave analysis of Gold. Many Elliott wave analysts have exactly the same count due to the clarity.
2-4 May Gold Elliott wave analysis: long term forecast
 Gold Elliott wave analysis, Weekly (click to zoom)
Since September 2011, Gold started a bearish corrective move from 1922 after completing a muti-year bullish impulse wave. No matter the time frame, the basic tenet remains the same - 5 waves up (down) followed by 3 waves down (up). It's that simple and we can see this happening. Wave A ended with an impulse wave in December 2015 and price turned upside for more than 26 months. If price would follow the wave count above, the B-wave is still ongoing and could extend to 1500 or above. From our Elliott wave perspective, Gold's long term outlook still remain northward. The corrective rally could end up as a double zigzag pattern. let's analyze wave Y of B.
2-4 May Gold Elliott wave analysis: medium term forecast
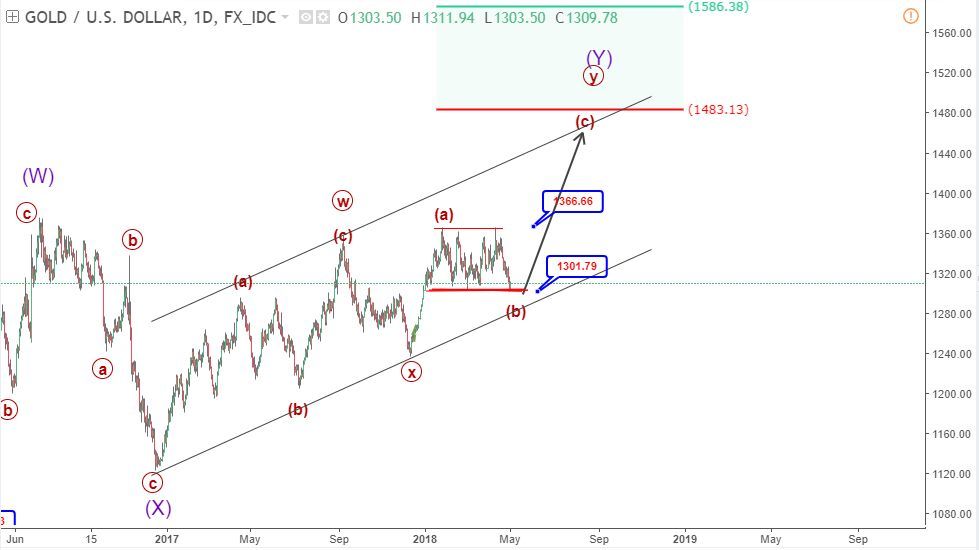
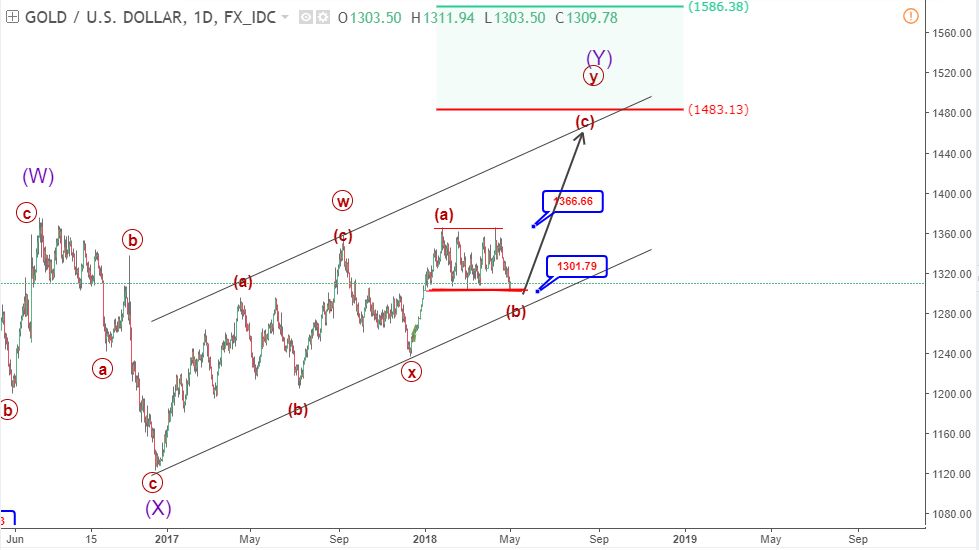 Gold Elliott wave analysis, Daily (click to zoom)


The emergence of the double zigzag bullish corrective pattern is expected to continue to 1483-1586. Unless price breaks below 1301 and channel support line (1280), the bullish move should continue to the top of the channel at 1440 or bridge above to 1483-1586 important price reversal levels. If you are a long term trader, you might want look for bullish clues. Stay tuned for the short term forecasts and ideas in the next update.
Do you have other views in contrast to the ones listed or you want to compliment them further? let’s know by your comment below.
Don’t forget to share this analysis with people that matter to you.