Litecoin resumed the corrective wave below $200 as the Crypto market bearish move continues. Here is the 18 January Litecoin price prediction showing the next LTC/USD and LTC/BTC forecast.
18 January, AtoZForex - Litecoin continued downside this week after a bearish breakout of a sideway pattern. Price went below $200 before the current recovery. The breakout was largely expected downside. In this article, we will use technical analysis, Elliott wave theory to look at what price could do next.
Prior to price going below $200, we had this triangle sideway pattern. In the last update, we looked at LTC/USD and LTC/BTC together and discovered both were expecting a breakout of a triangle pattern. LTCUSD was meant to breakout downside LTC/BTC on the other hand had one more leg to complete before a bullish breakout.
As for LTC/USD, we had the chart below.
LTC/USD price chart, H2 (click to zoom)
It should be noted also that, like LTC/BTC, the major trend before the triangle is bullish. A 3-wave dip may not happen to $120 unless there is a good breakout downside. If we can use LTC/BTC as a parameter, then we could say that price has a higher chance of breaking upside

From recent experience in Ripple and Ethereum, there was a chance of bullish move despite the immediate trend is bearish. But, price did as originally expected - a bearish dip. What should we expect next?


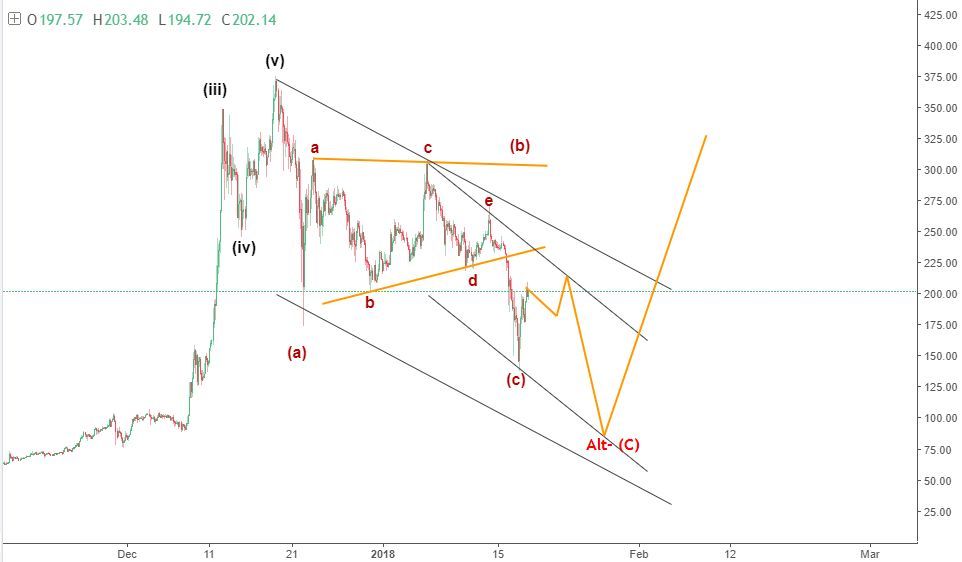
18 January Litecoin price prediction - LTC/USD Forecast
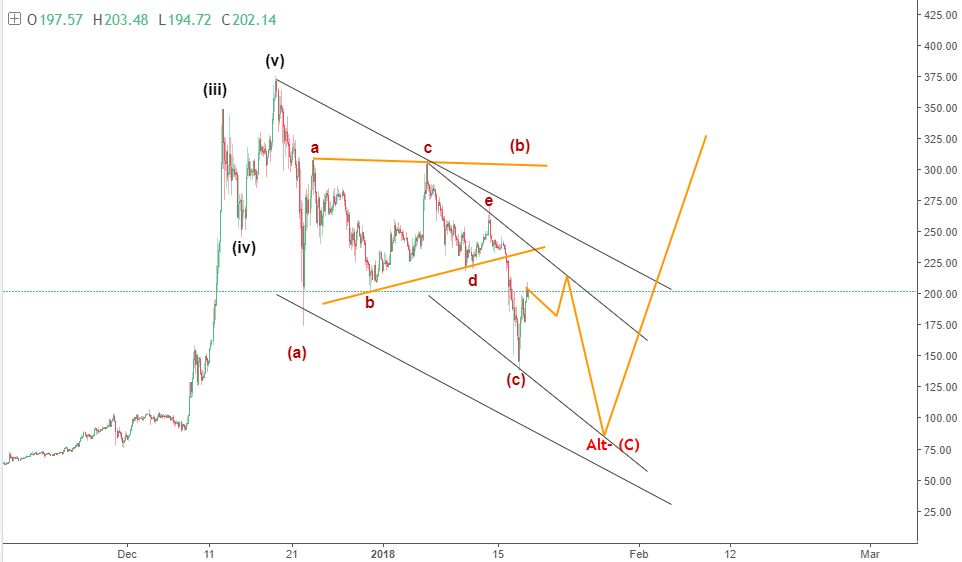 LTC/USD price chart (Elliott wave analysis), H3 (click to zoom)
The chart above shows a zigzag/double zigzag pattern. A dip could still happen to $75-$100 before the rally resume. Once this correction is over, a rally above $500 should follow in the coming weeks.
LTC/BTC, on the other hand, in the last update had this chart.
The chart above shows a triangle about to complete the last leg. The prevailing trend is bullish and this is expected to be followed by a breakout upside.
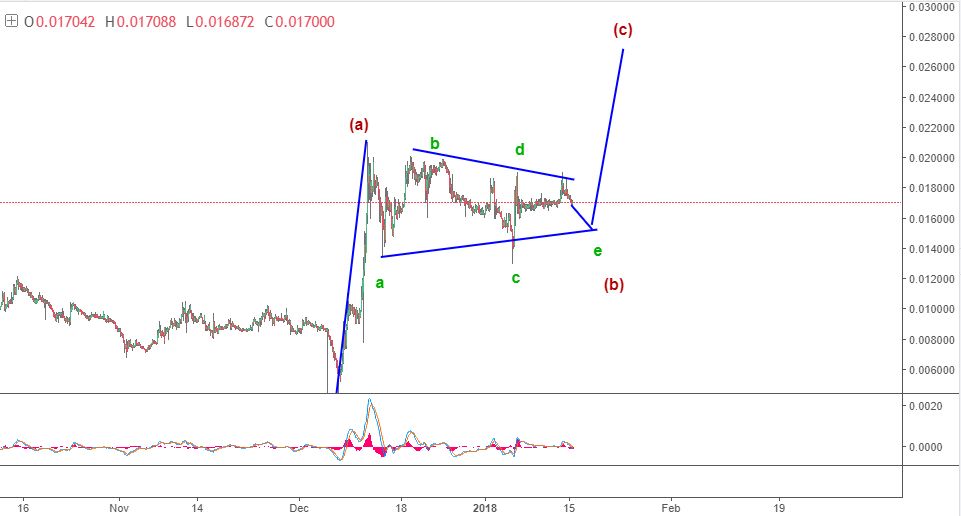
And here is what we have now below.
18 January Litecoin price prediction - LTC/BTC Forecast
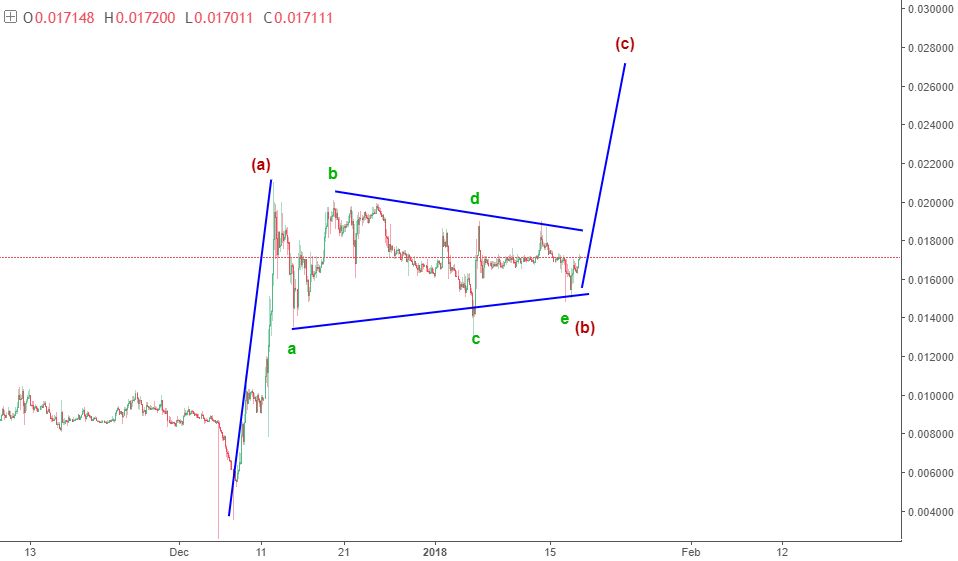 LTC/BTC price chart (Elliott wave analysis), H3 (click to zoom)
The last leg of the triangle has been completed. A breakout could happen upside soon and price rally to 0.003.
Do you have other views in contrast to the ones listed or you want to compliment them further? let’s know by your comment below.
Don’t forget to share this analysis with people that matter to you.