
After falling sharply from the impulse wave rally, Gold has been recovering. We look at the possibilities of the continuation of the bearish correction. Will the bearish correction continue or it has completed for the big rally to resume? These are answered below based on 17 March Gold daily Elliott wave analysis.
17 March, AtoZForex - In the update we did on 3rd March, we we believed price would fall after recognizing a classic impulse wave. The fall, which was expected to be corrective, was very sharp. In the last update before the rate hike, counted a 5-wave impulsive dip as wave (a) of a zigzag correction. Wave (a) was in the last phase, completing its 5th sub-wave and price was kept with a falling channel. The idea was for the bullish intraday buyers to wait for this pattern to complete at 1180.xx support before looking for a bullish opportunity. The chart below was used.
 Gold Elliott wave analysis, H4 (click to zoom)
If the recent intraday rally holds below 1212.35 ((wave (iv)), a break below the rally channel could send price downside toward 1180.xx. After the dip to 1180.xx, a fast break above the bigger bearish channel can trigger a corrective rally and a bigger opportunity.
Price later broke above 1212 important level after the FOMC meeting to invalidate our view. Has the bearish correction completed with this bullish surge?. Will price go further upside?. The chart below shows our updated wave count.
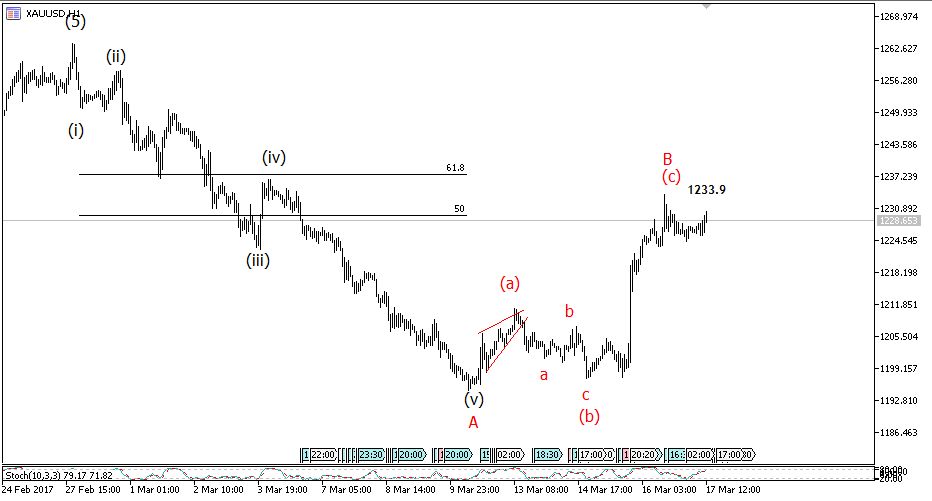 Gold Elliott wave analysis, H1 (click to zoom)
The chart above shows that wave A completed with an impulse wave above 1190. The rally triggered by the Fed rate hike is labelled as wave B ( a corrective wave). The correction, if completed, is formed at the 50% Fibp-retracement of wave A. This ratio is often seen in zigzags. Price could be on its way to complete the zigzag downside with another impulse wave below 1190. The chart below shows the sub-waves of wave B.


17 March Gold daily Elliott wave analysis: bearish setup?
 Gold Elliott wave analysis, M15 (click to zoom)
We assume wave B is complete and bearish move for wave C has already started with what could be the sub-waves of wave C. This will be confirmed by a bearish breakout below 1224.21 and held below 1233.9. A break above 1233.9 will invalidate this setup and force us to look up to 1238 for reversals. If the bearish move is genuine, a dip below 1190 is very likely.
Do you have other views in contrast to the ones listed or you want to compliment them further? let’s know by your comment below.
Don’t forget to share this analysis with people that matter to you.